
So…what’s it gonna be for 2024? Has the San Francisco real estate market found bottom? I do believe it has. Are the sellers who’ve been sitting and waiting to sell going to finally pull the trigger and give us the inventory we need? I sure as heck hope so. Follow this link for the first market report of … Continue reading San Francisco Real Estate Market Has Found Bottom
Category: Stats & Numbers

A 1.18% Mortgage Rate Drop Matters … A LOT!
It’s that time of year…numbers from the prior year come in, get crunched, and speculation for the coming year begins. There is a TON of data and resources to search, and you can read and try to time real estate all you want. We’re just here to narrow it down for you and guide you along the … Continue reading A 1.18% Mortgage Rate Drop Matters … A LOT!

San Francisco Real Estate Market Update To End The Year 2023
It seems I just put out the last San Francisco real estate market report, and the next one already landed. Numbers are in, and you can read the entire macro and micro real estate report right here. For me, I’m an images and charts guy and sometimes get lost in words, so here are the most … Continue reading San Francisco Real Estate Market Update To End The Year 2023

sfnewsletter 4/20/23 edition
I started sfnewsletter at least as far back as 2004, and look at that…still sending you real estate market updates after all these years… Check out this OLD post from 2007! And yes, The Goods is still great: Overbids, Underbids, everything in between. The Big Story Bank failures and rate hikes Quick Take: Note: You … Continue reading sfnewsletter 4/20/23 edition

A Little Update On Our Market, and Overbids
Follow this link right here for the latest San Francisco Real Estate Market report: November Real Estate Market Report Now then, did you know that despite everything that’s going on in the world and the economy, including the fact that everything should stop so we can all watch World Cup games day in and day … Continue reading A Little Update On Our Market, and Overbids

Marina District Home Sells $1,166,000 Over Asking, Market Corrects?
You read that right, a fixer listed for $3,500,000 at 3666 Baker just closed $1,166,000 over asking for a $4,666,000 sales price. That ain’t spooky Halloween sh*t either. (If you miss the 666 reference I feel for you.) Such is the life of buying and selling in San Francisco. Kinda like when you walk down … Continue reading Marina District Home Sells $1,166,000 Over Asking, Market Corrects?

Single Family Home Prices Down 23%, Condos 25% Since Peak
Just cranked out another San Francisco Real Estate Market report and the data is beginning to show the slowdown. Is this the tip of the iceberg or will it turn? We’ll keep eyes on it for you, all you need to do is keep eyes on us. Prices tend to stagnate or decline this time … Continue reading Single Family Home Prices Down 23%, Condos 25% Since Peak
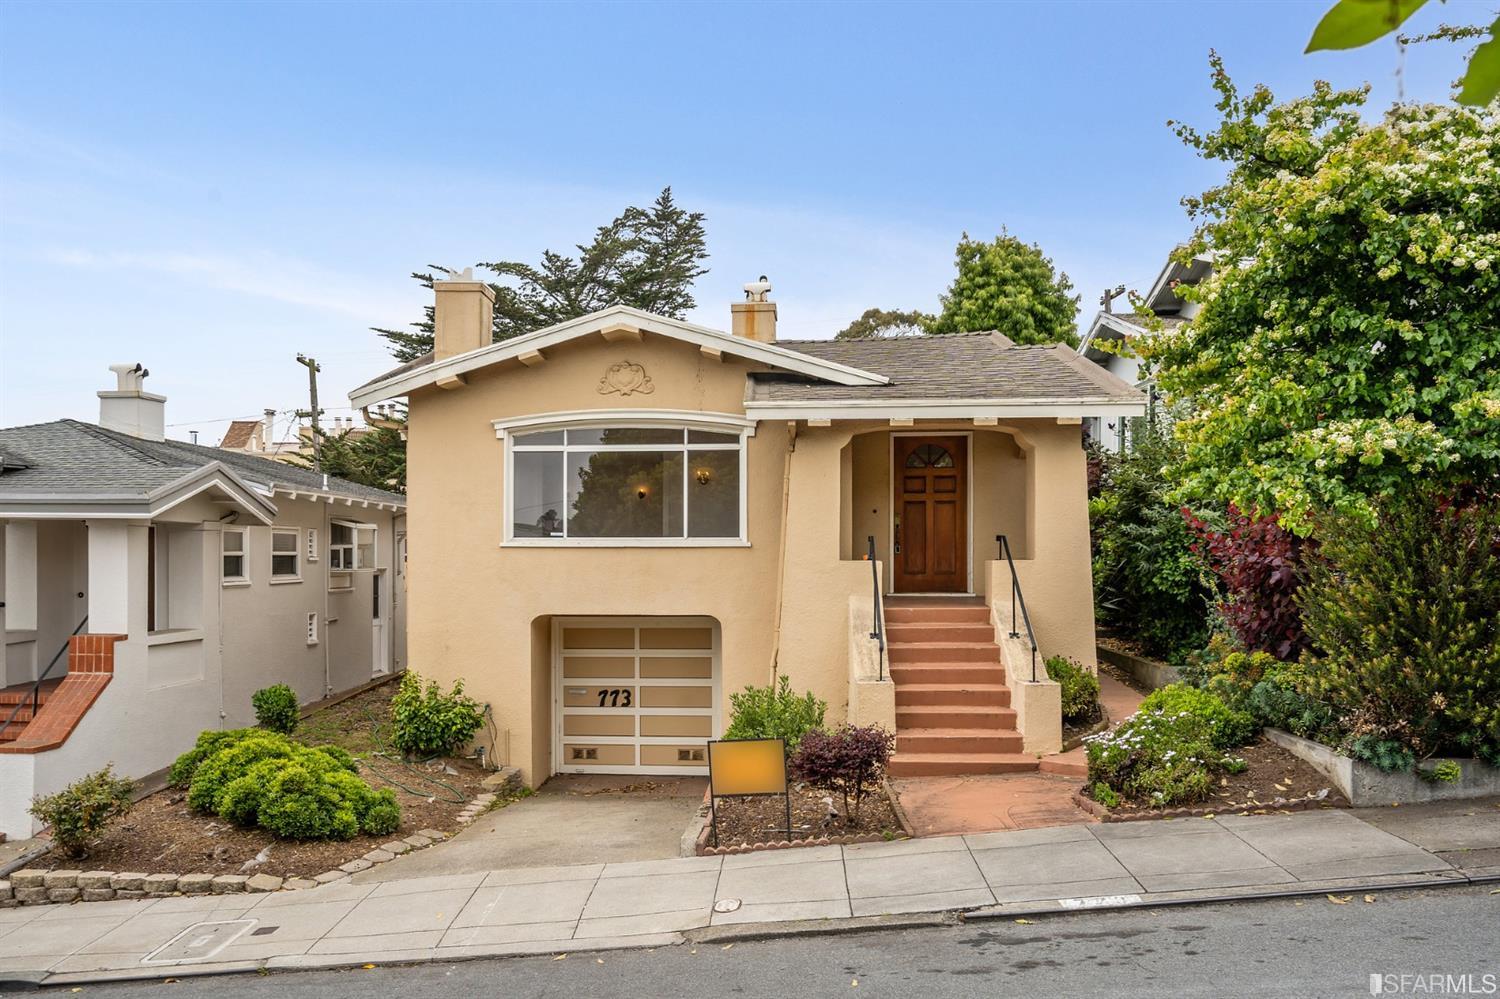
Top SF Overbids: Westwood Park Basement Breaks the Bank
Ah summer, when a San Francisco homebuyer’s fancy turns toward paying more for a home–or at least that’s how it seems when we break down this week’s top SF overbids. Most weeks, San Francisco overbids are relatively modest, but our current number one spot is actually quite a whopper in the form of 773 Faxon … Continue reading Top SF Overbids: Westwood Park Basement Breaks the Bank

San Francisco Median Home Prices Reach New All – Time Highs
The San Francisco real estate market continues to roar onward and upwards bringing sustained disappointment to buyers, and almost immediate elation to sellers (assuming your property is priced right, and located well.) Find all of the market data you could imagine in theFrontSteps’ newsletter. That link again to the entire market report is right here, … Continue reading San Francisco Median Home Prices Reach New All – Time Highs

May Housing Market Update for San Francisco
During April 2021 in San Francisco, the median single-family home price rose once again to an all-time high, and condo prices fell. Year-over-year, single-family home prices meaningfully increased, up 10%, while condo prices declined 5%. To say it’s a nutty market would be a huge understatement. Keep in mind the numbers take averages. There are … Continue reading May Housing Market Update for San Francisco
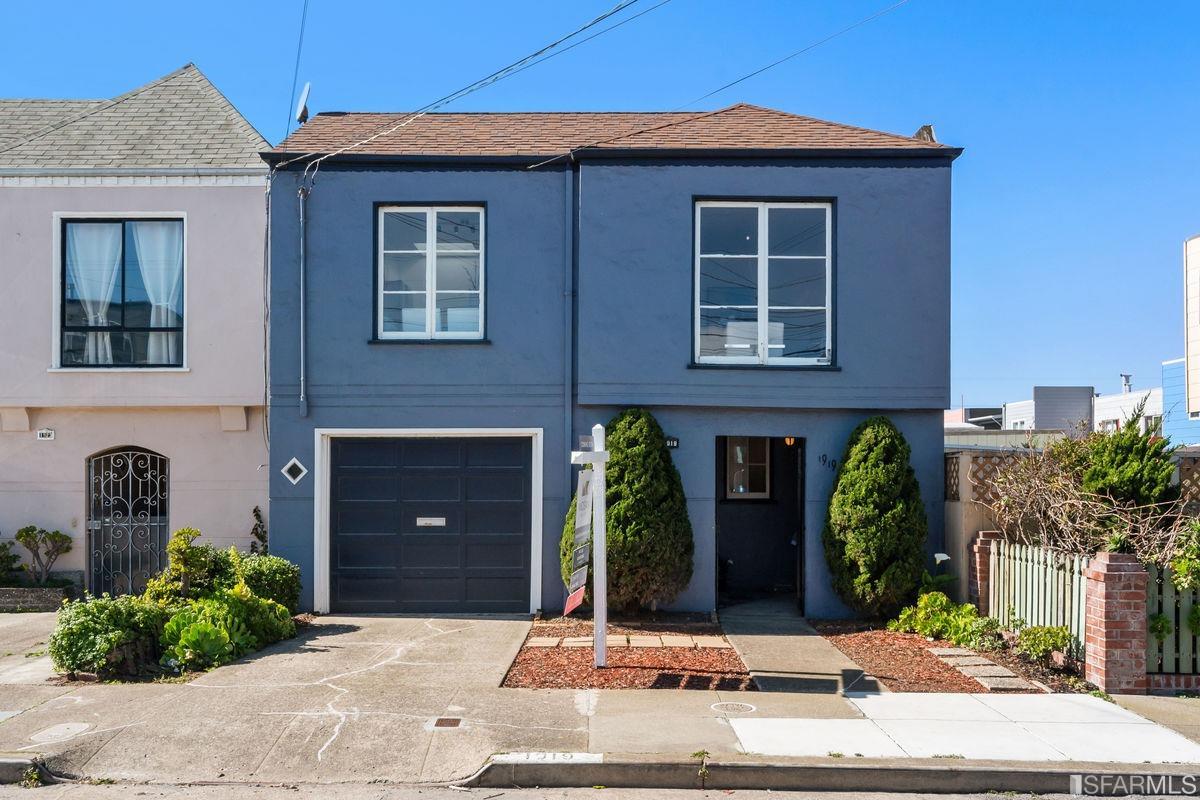
Outer Sunset Home Sells $401,000 Over Asking | Ocean Beach Surfers Everywhere Shake Their Heads
It’s safe to say people still want to live in San Francisco, especially San Francisco’s Outer Sunset District. With 1919 47th Ave listing at $999,000, and selling for $1,400,000 (mind you we’re still technically in the grips of this pandemic), one can only shake their head in disbelief. This is not the only insane overbid. … Continue reading Outer Sunset Home Sells $401,000 Over Asking | Ocean Beach Surfers Everywhere Shake Their Heads

SF Real Estate Market Hot Here Cool There
Welcome to our February newsletter. This month, we cover long-term trends in the United States, considering the ways in which history can inform our future. We also compare the 2020 and 2019 calendar years in our local area, using 2019 as a “normal” year to reflect upon 2020 trends. We don’t want to jinx anything, … Continue reading SF Real Estate Market Hot Here Cool There

San Francisco Real Estate Market Report January 2021
What better way to spend a rainy Sunday than reading our latest and great San Francisco Real Estate market report. Click the link or the image to see the full report. January Housing Market Updates for San Francisco The median single-family home and condo prices fell month-over-month, which is typical for the winter season. Year-over-year, … Continue reading San Francisco Real Estate Market Report January 2021

How the Pandemic Has Affected San Francisco Real Estate
We’re finally getting some solid data for how the housing market has been impacted by the COVID-19 Pandemic and coinciding shelter in place. The data is available for your viewing pleasure by following this link: theFrontSteps’June Real Estate Report: As for what else has been happening, you can always track sales in real time on … Continue reading How the Pandemic Has Affected San Francisco Real Estate

San Francisco Real Estate Trends in COVID-19 Lockdown
We just released our monthly real estate market report and forecast newsletter. If you’ve been subscribed to it, check your spam folders, find it, read it, send it to a friend. Can’t find it, we got you. Read the full report by following this link. –theFrontSteps Newsletter – Real Estate Trends in COVID-19 Lockdown Subscribe … Continue reading San Francisco Real Estate Trends in COVID-19 Lockdown
View post to subscribe to site newsletter.

California Real Estate Market & Industry Summary 4/21/2020
“As unemployment has skyrocketed, the housing market has slowed — and it’s likely to remain slow as more jobs are lost. [California Association of Realtors] C.A.R.’s March sales report shows the market in California has begun to feel the effects of the virus, with existing, single-family home sales down 11.5 percent from February and 6.1 … Continue reading California Real Estate Market & Industry Summary 4/21/2020