
Prices for both single-family homes and condos made a real jump last month. Things are still moving quickly because there just aren’t enough homes to go around. That low inventory continues to be the main hurdle for buyers and a big factor for sellers. We’re seeing all this activity as we head into the typical summer slowdown, but it’s clear that people who want to sell and buy are still out there making it happen.
Quick Take:
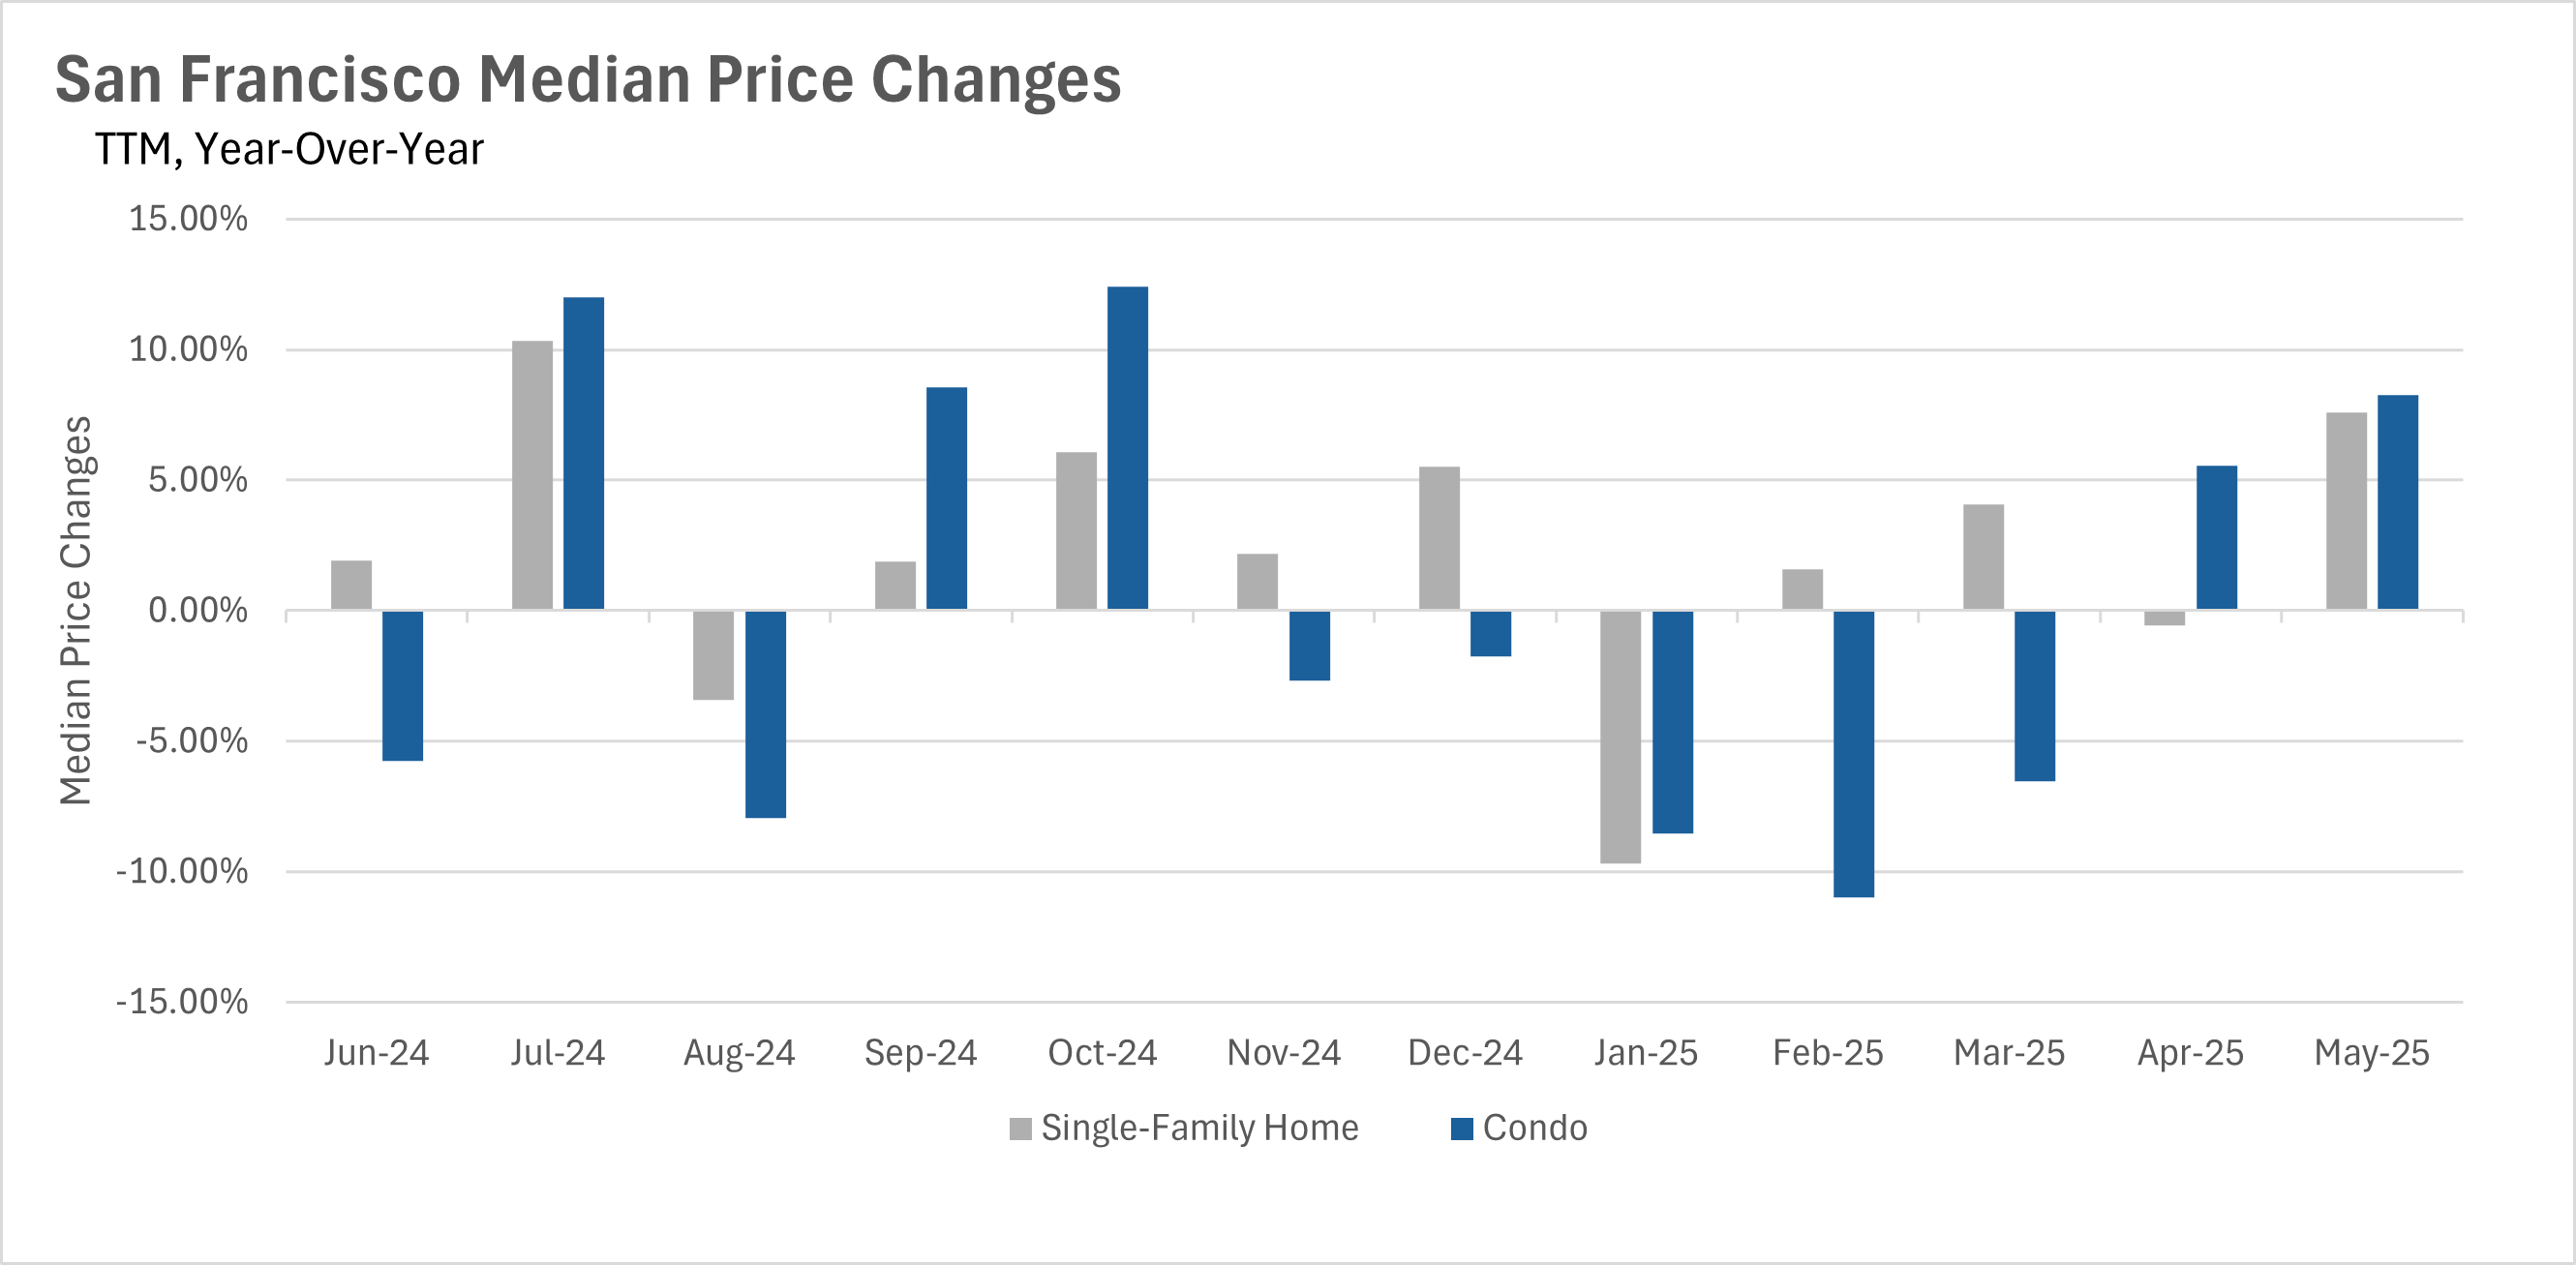
- Median sale prices surge upward on a year-over-year basis, with condo values increasing by more than 8%.
- Inventories remain lower than they were last year, as fewer listings hit the market
- Listings are being bought up incredibly quickly, with the average single-family home spending less than two weeks on the market.
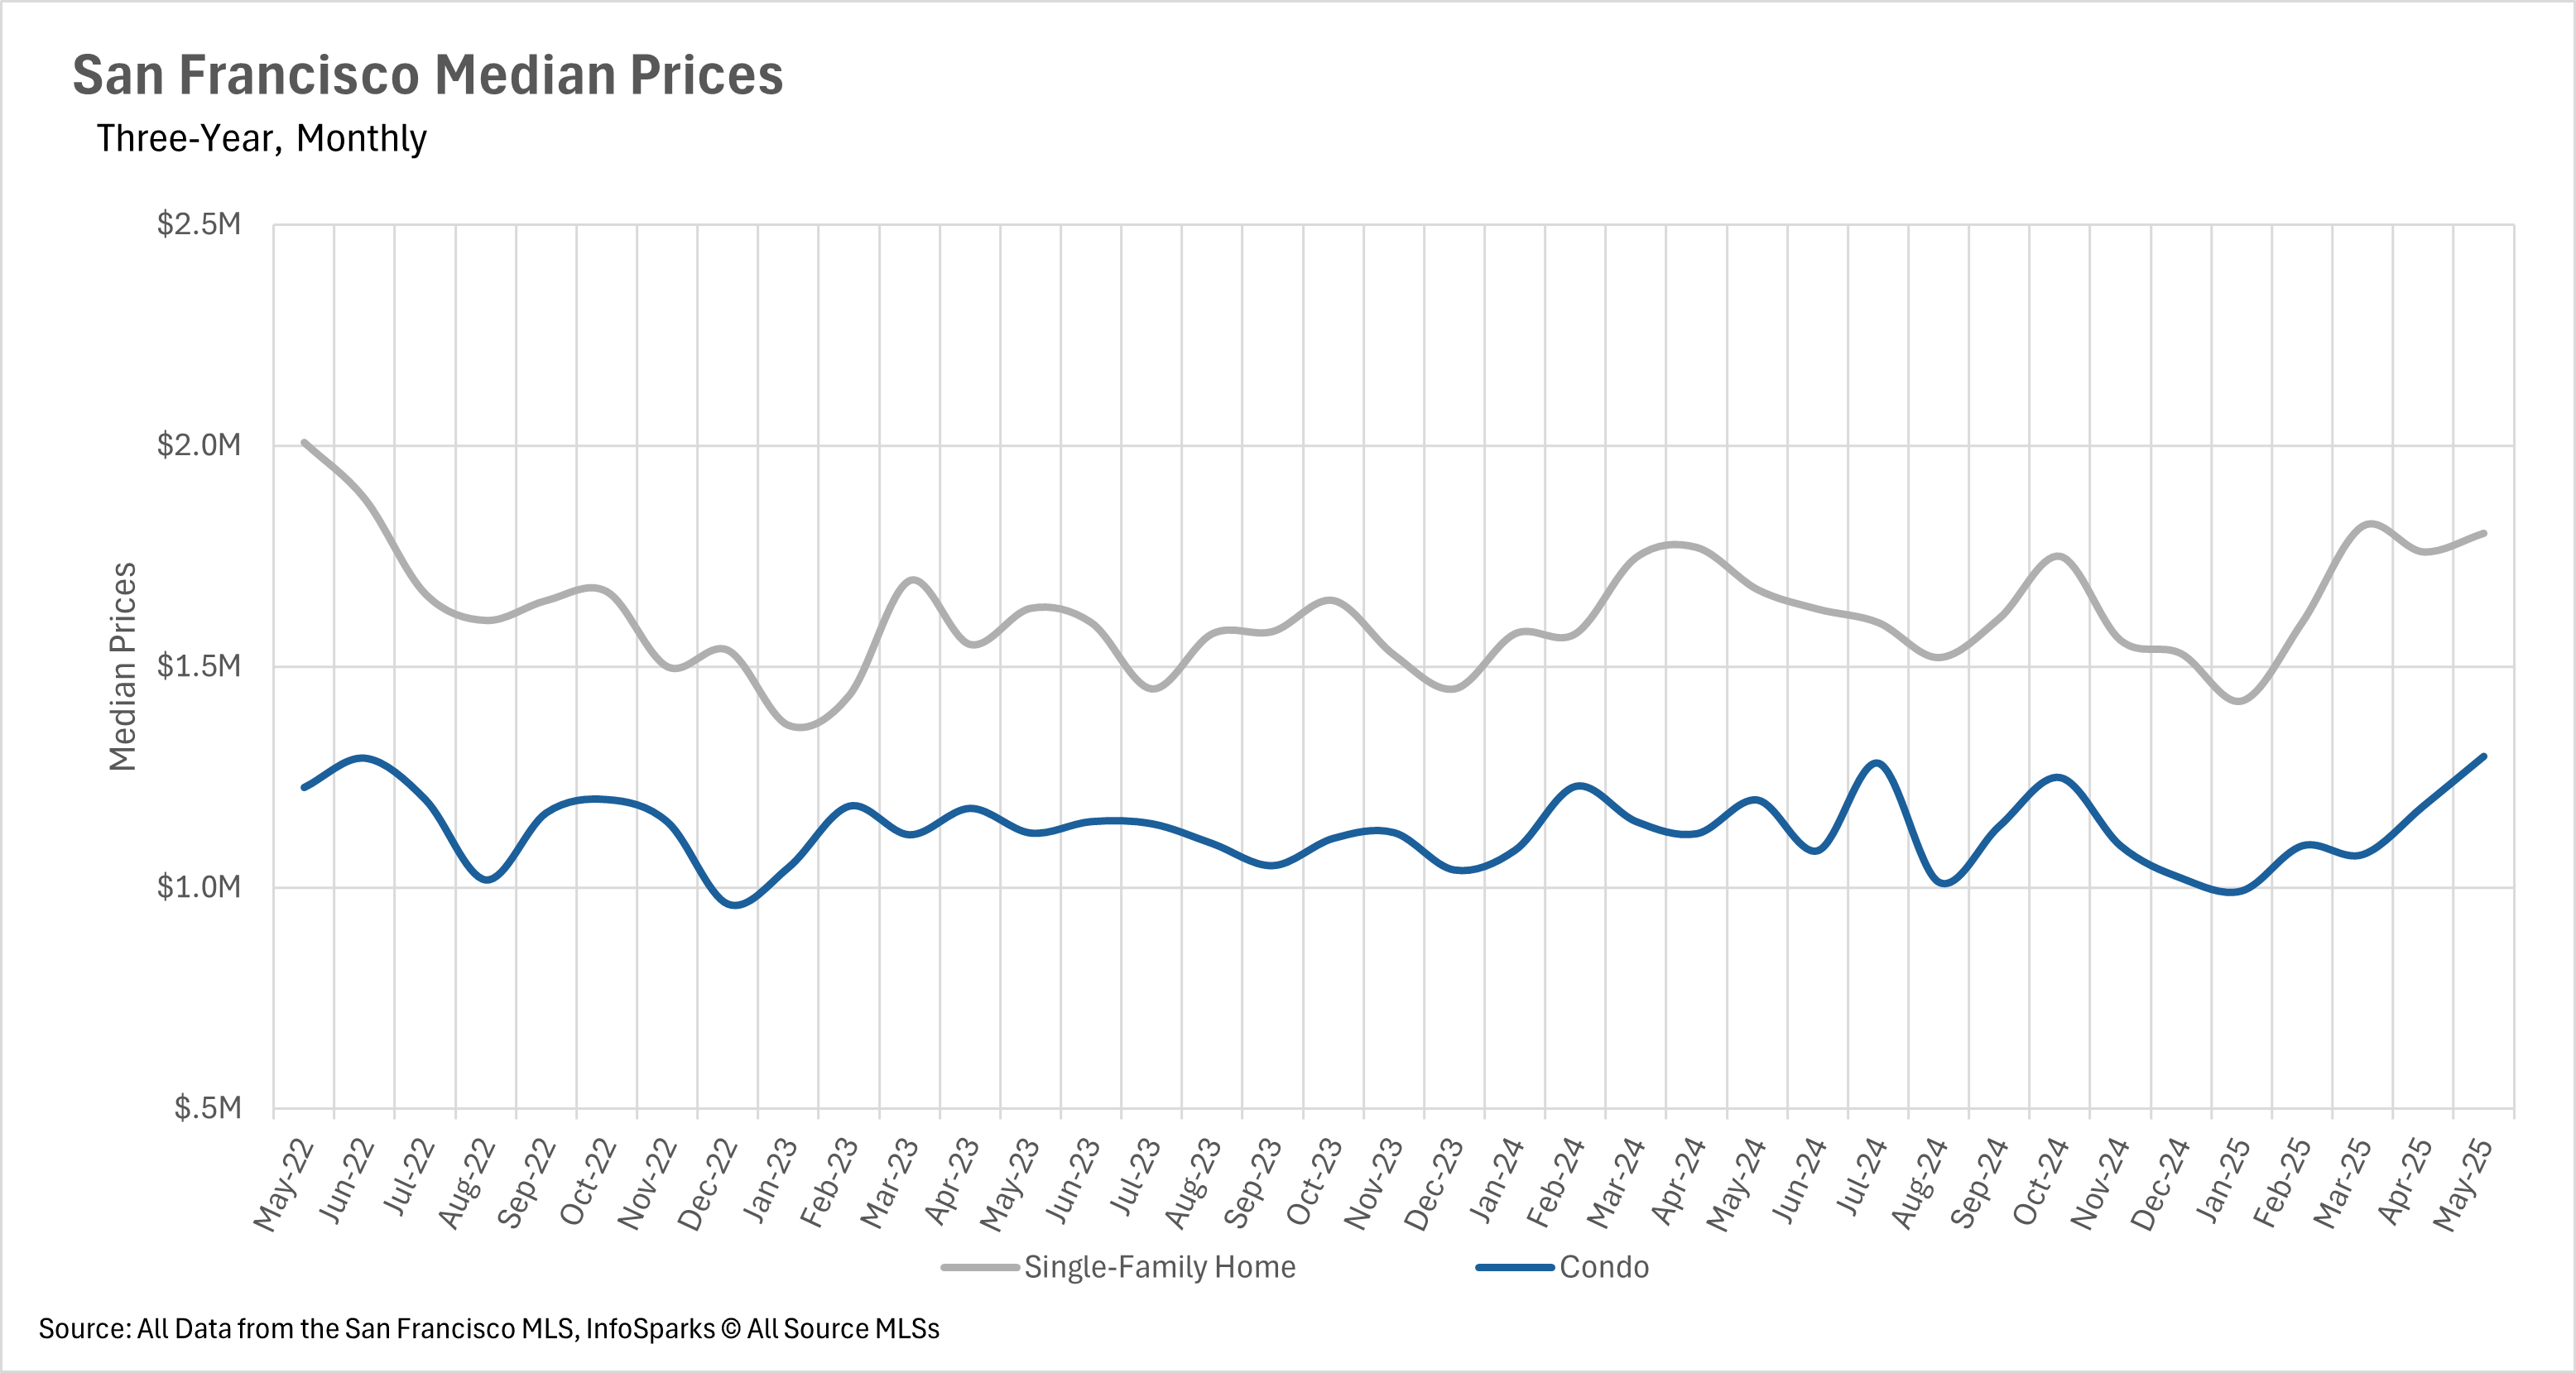
San Francisco median sale prices surge in May
Although many markets have seen a downtrend in pricing, San Francisco has remained incredibly resilient. In fact, in the month of May, we saw quite a surge in median sales prices, with home values reaching some of the highest levels we’ve seen in over two years. The median single-family home was sold for $1,802,000, a 7.58% increase compared to May of last year. Whereas the median condo was sold for $1,298,000, representing a year-over-year increase of 8.26%. This phenomenon is likely due to the fact that inventories have been downtrending for years at this point.
Inventory levels remain lower than where they were last year
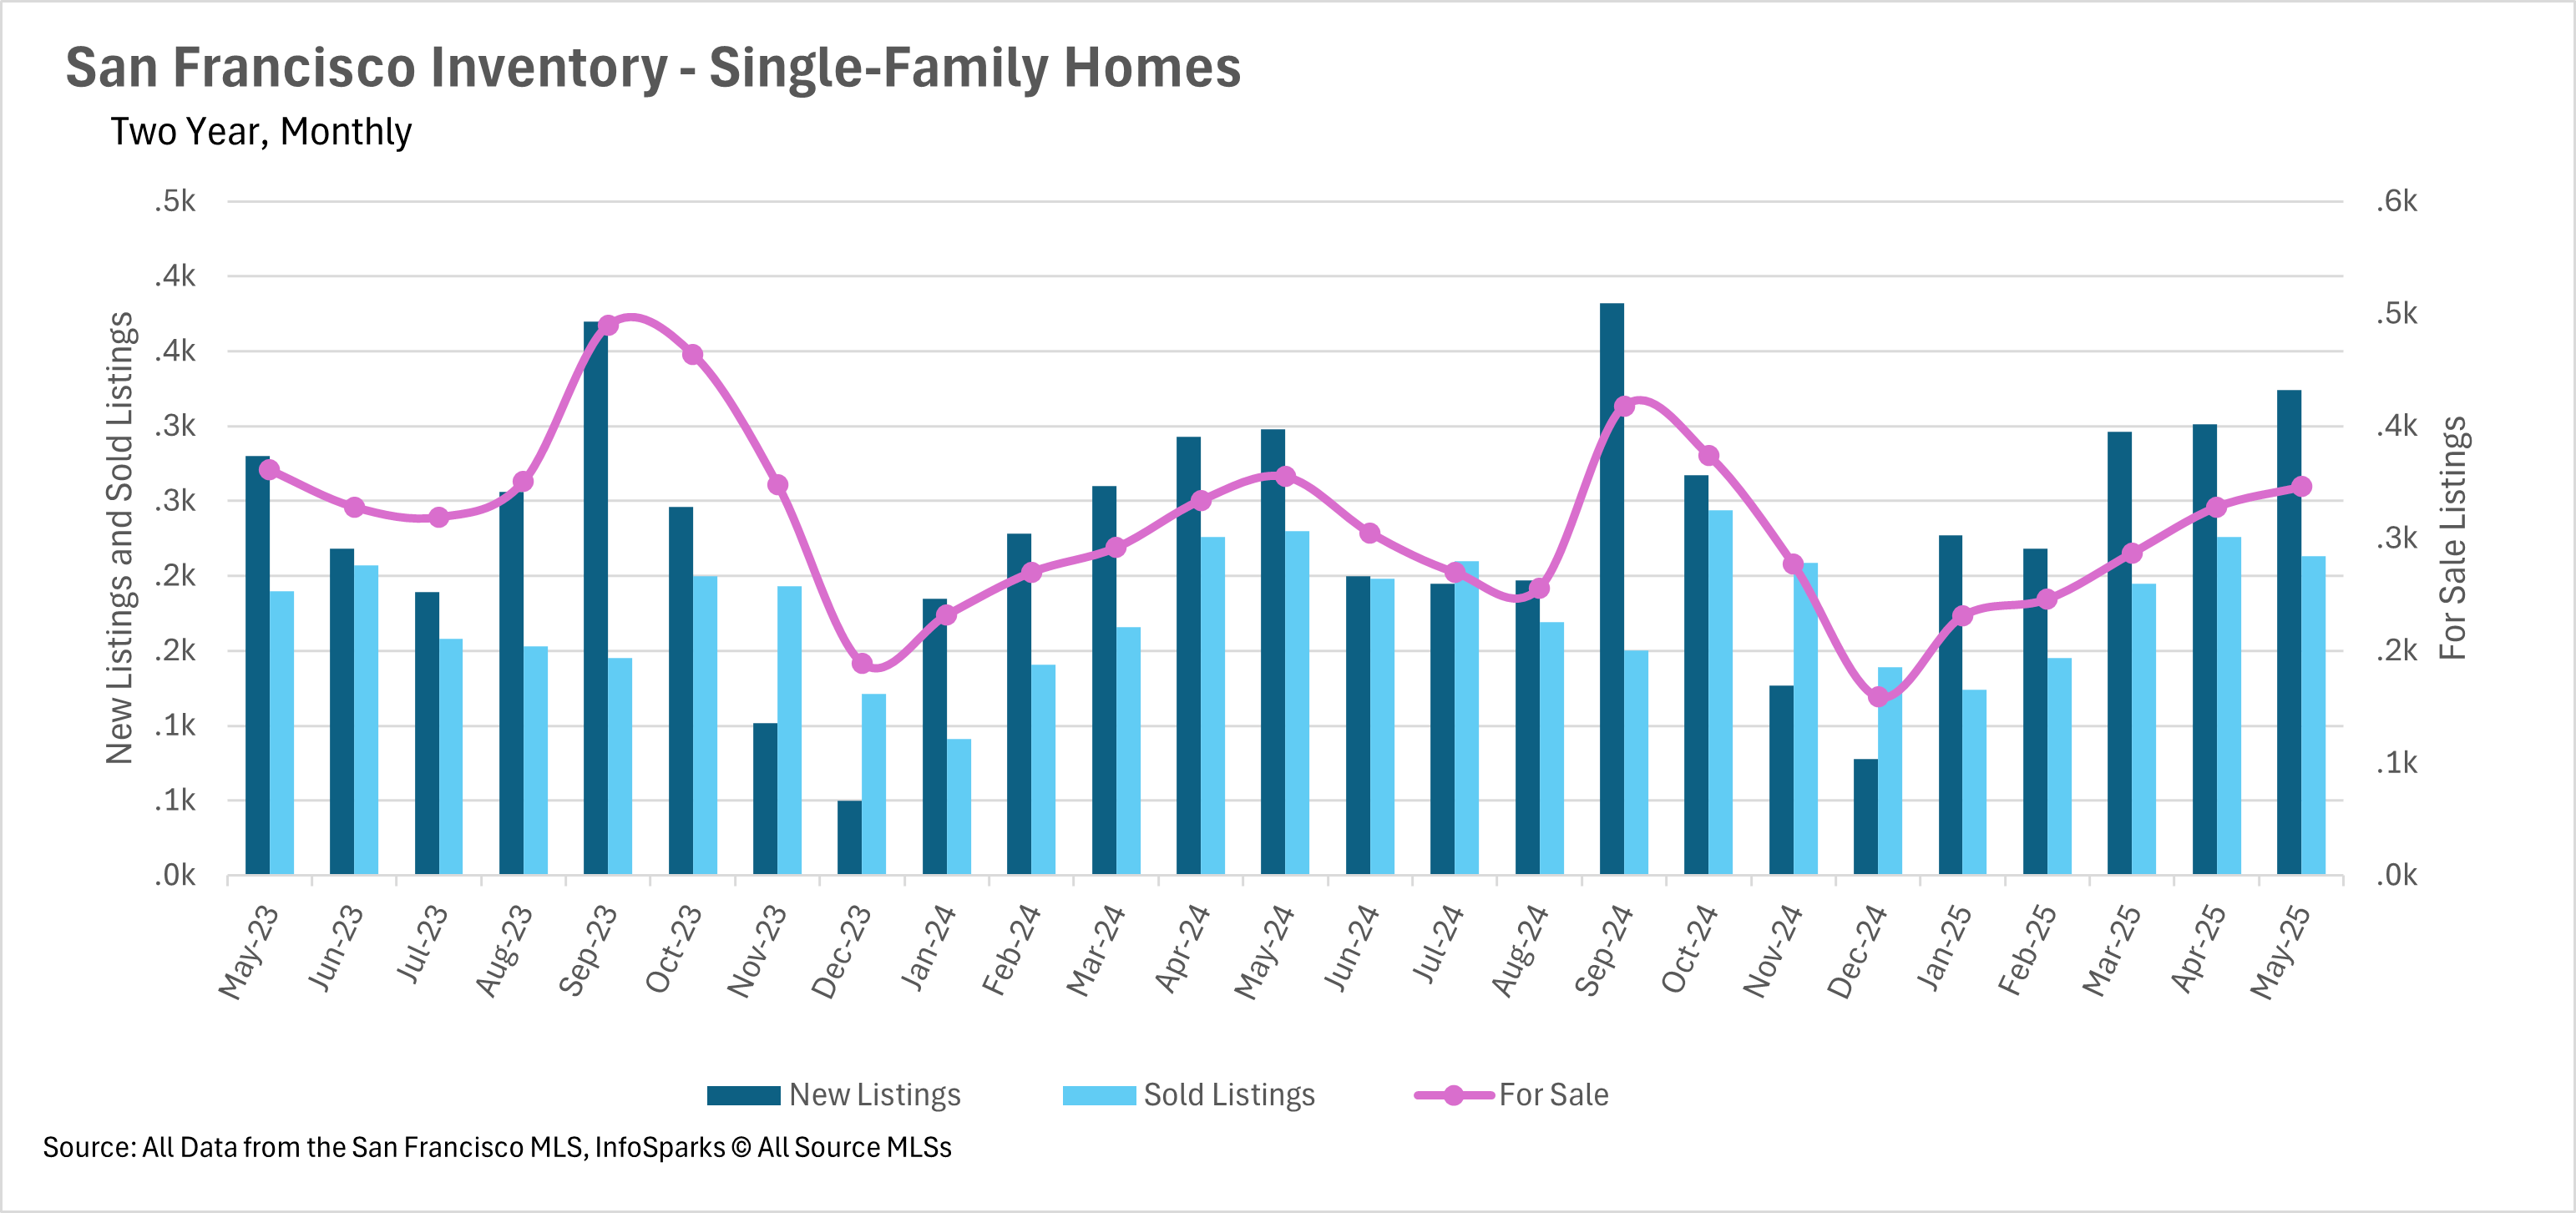
As we just mentioned, inventories have been on the downtrend in San Francisco for years, and this streak continued in the month of May. Single-family home inventories were down 2.54% on a year-over-year basis, despite the fact that they were up 5.49% on a month-over-month basis. This phenomenon is interesting, as sales were down 7.39%, while new listings were up 8.72% on a year-over-year basis.
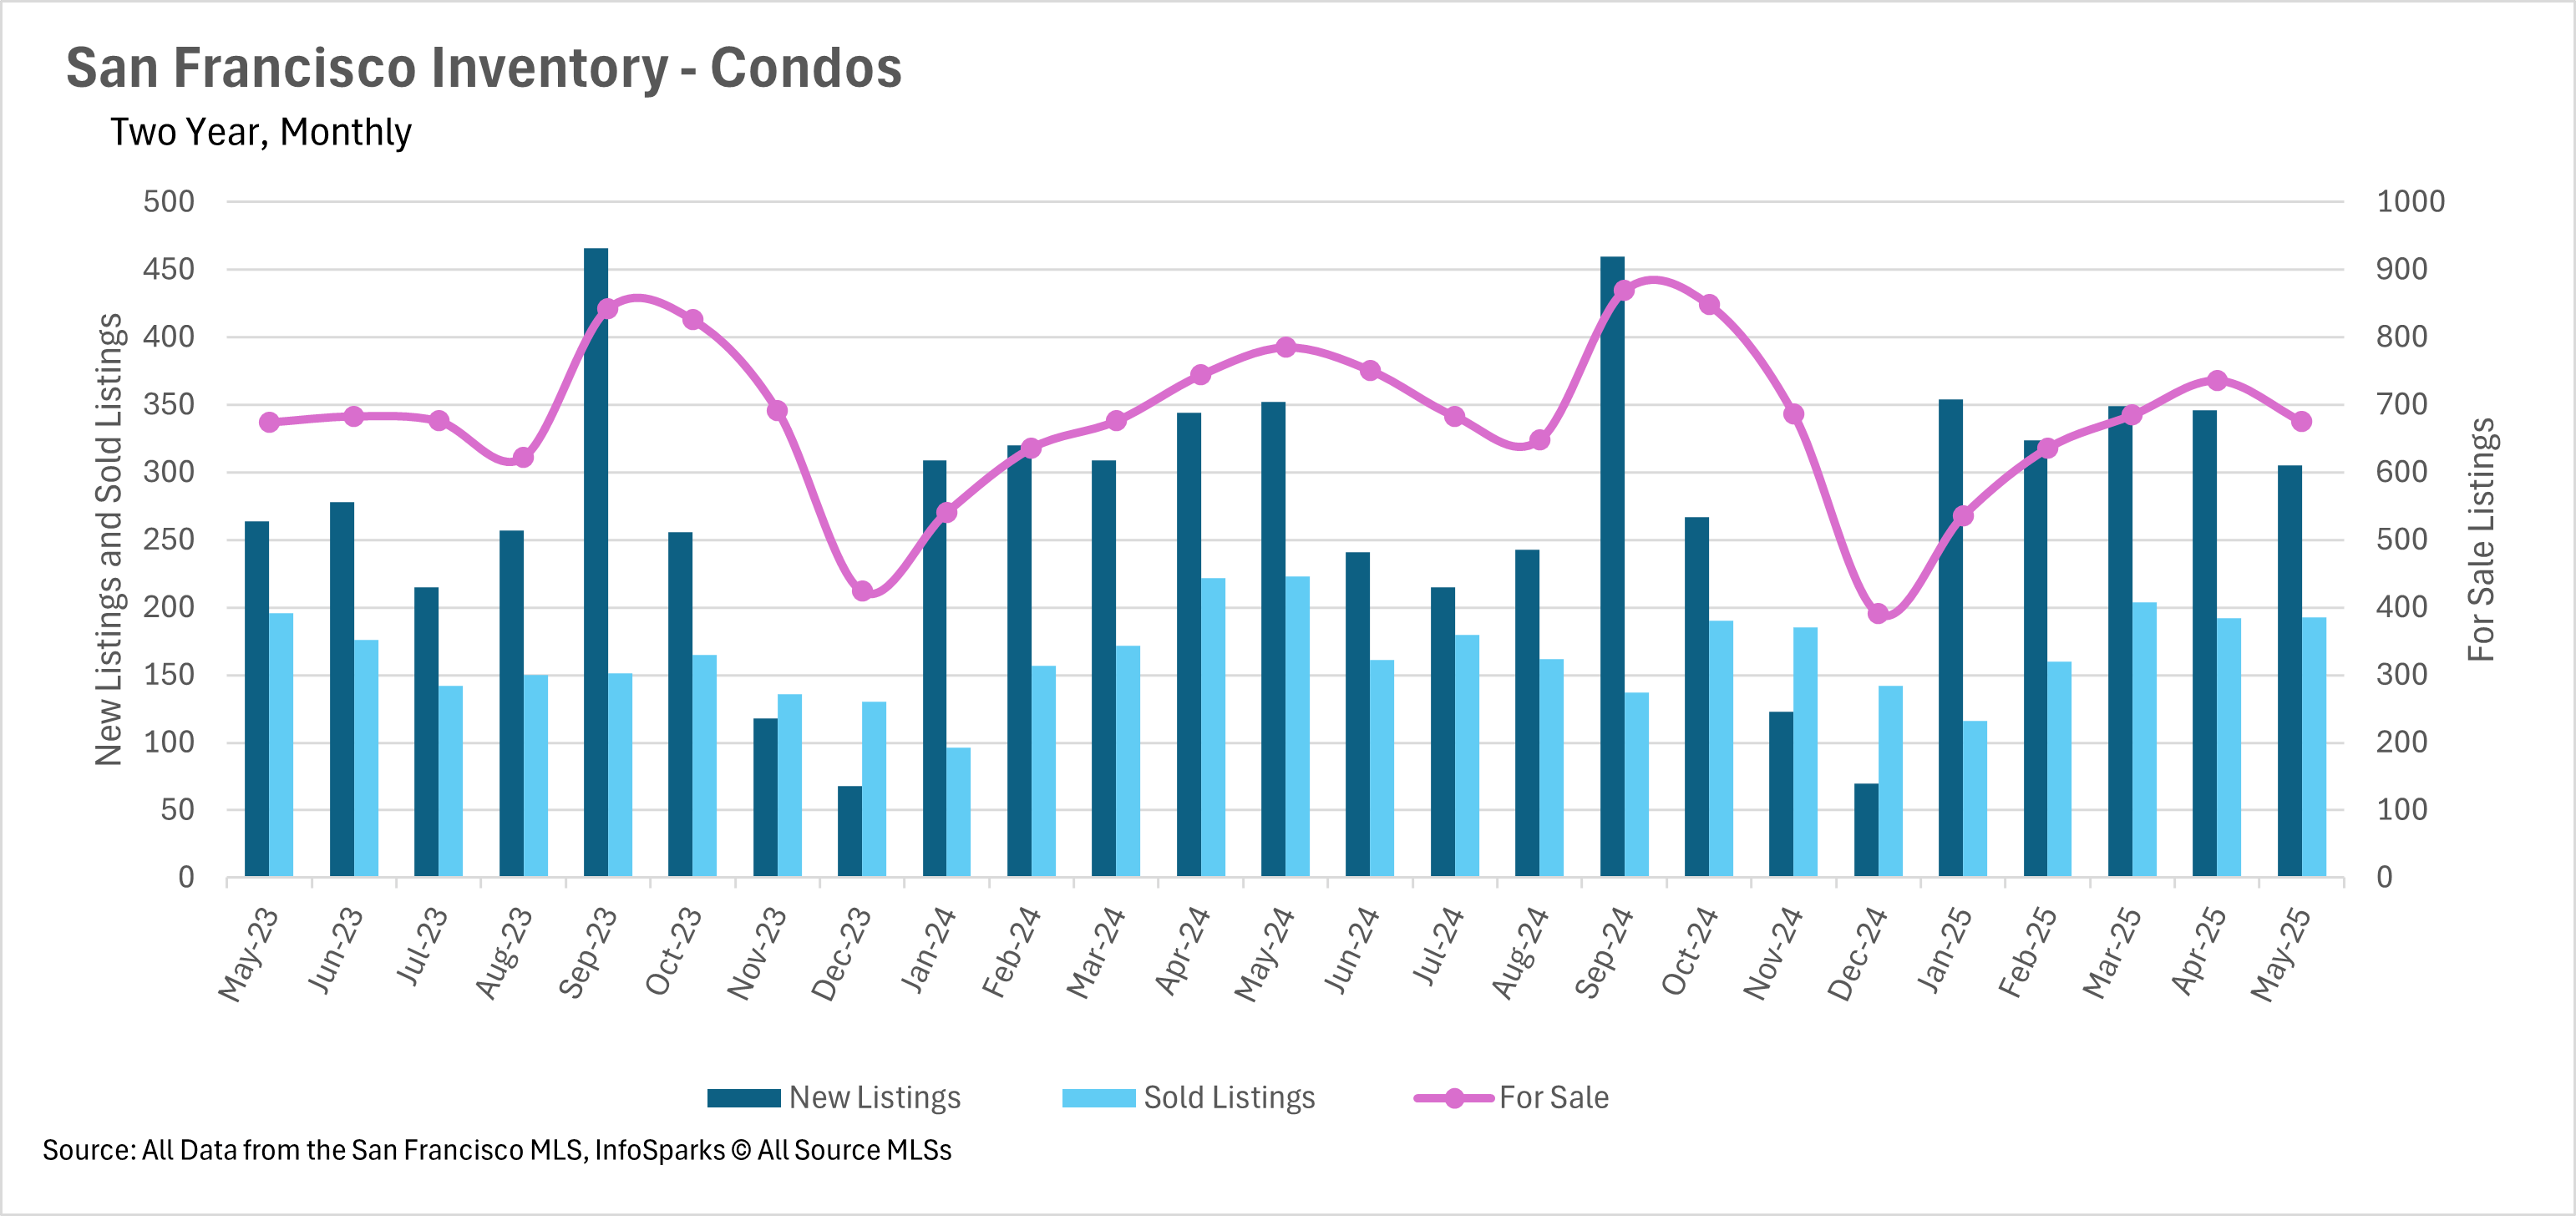
When we turn to the condo market, we see an even more drastic decline, with there being 14.01% fewer active condo listings than this time last year. This drop in inventory falls roughly in line with the 13.35% decrease in new listings and the 13.45% decrease in sold listings on a year-over-year basis.
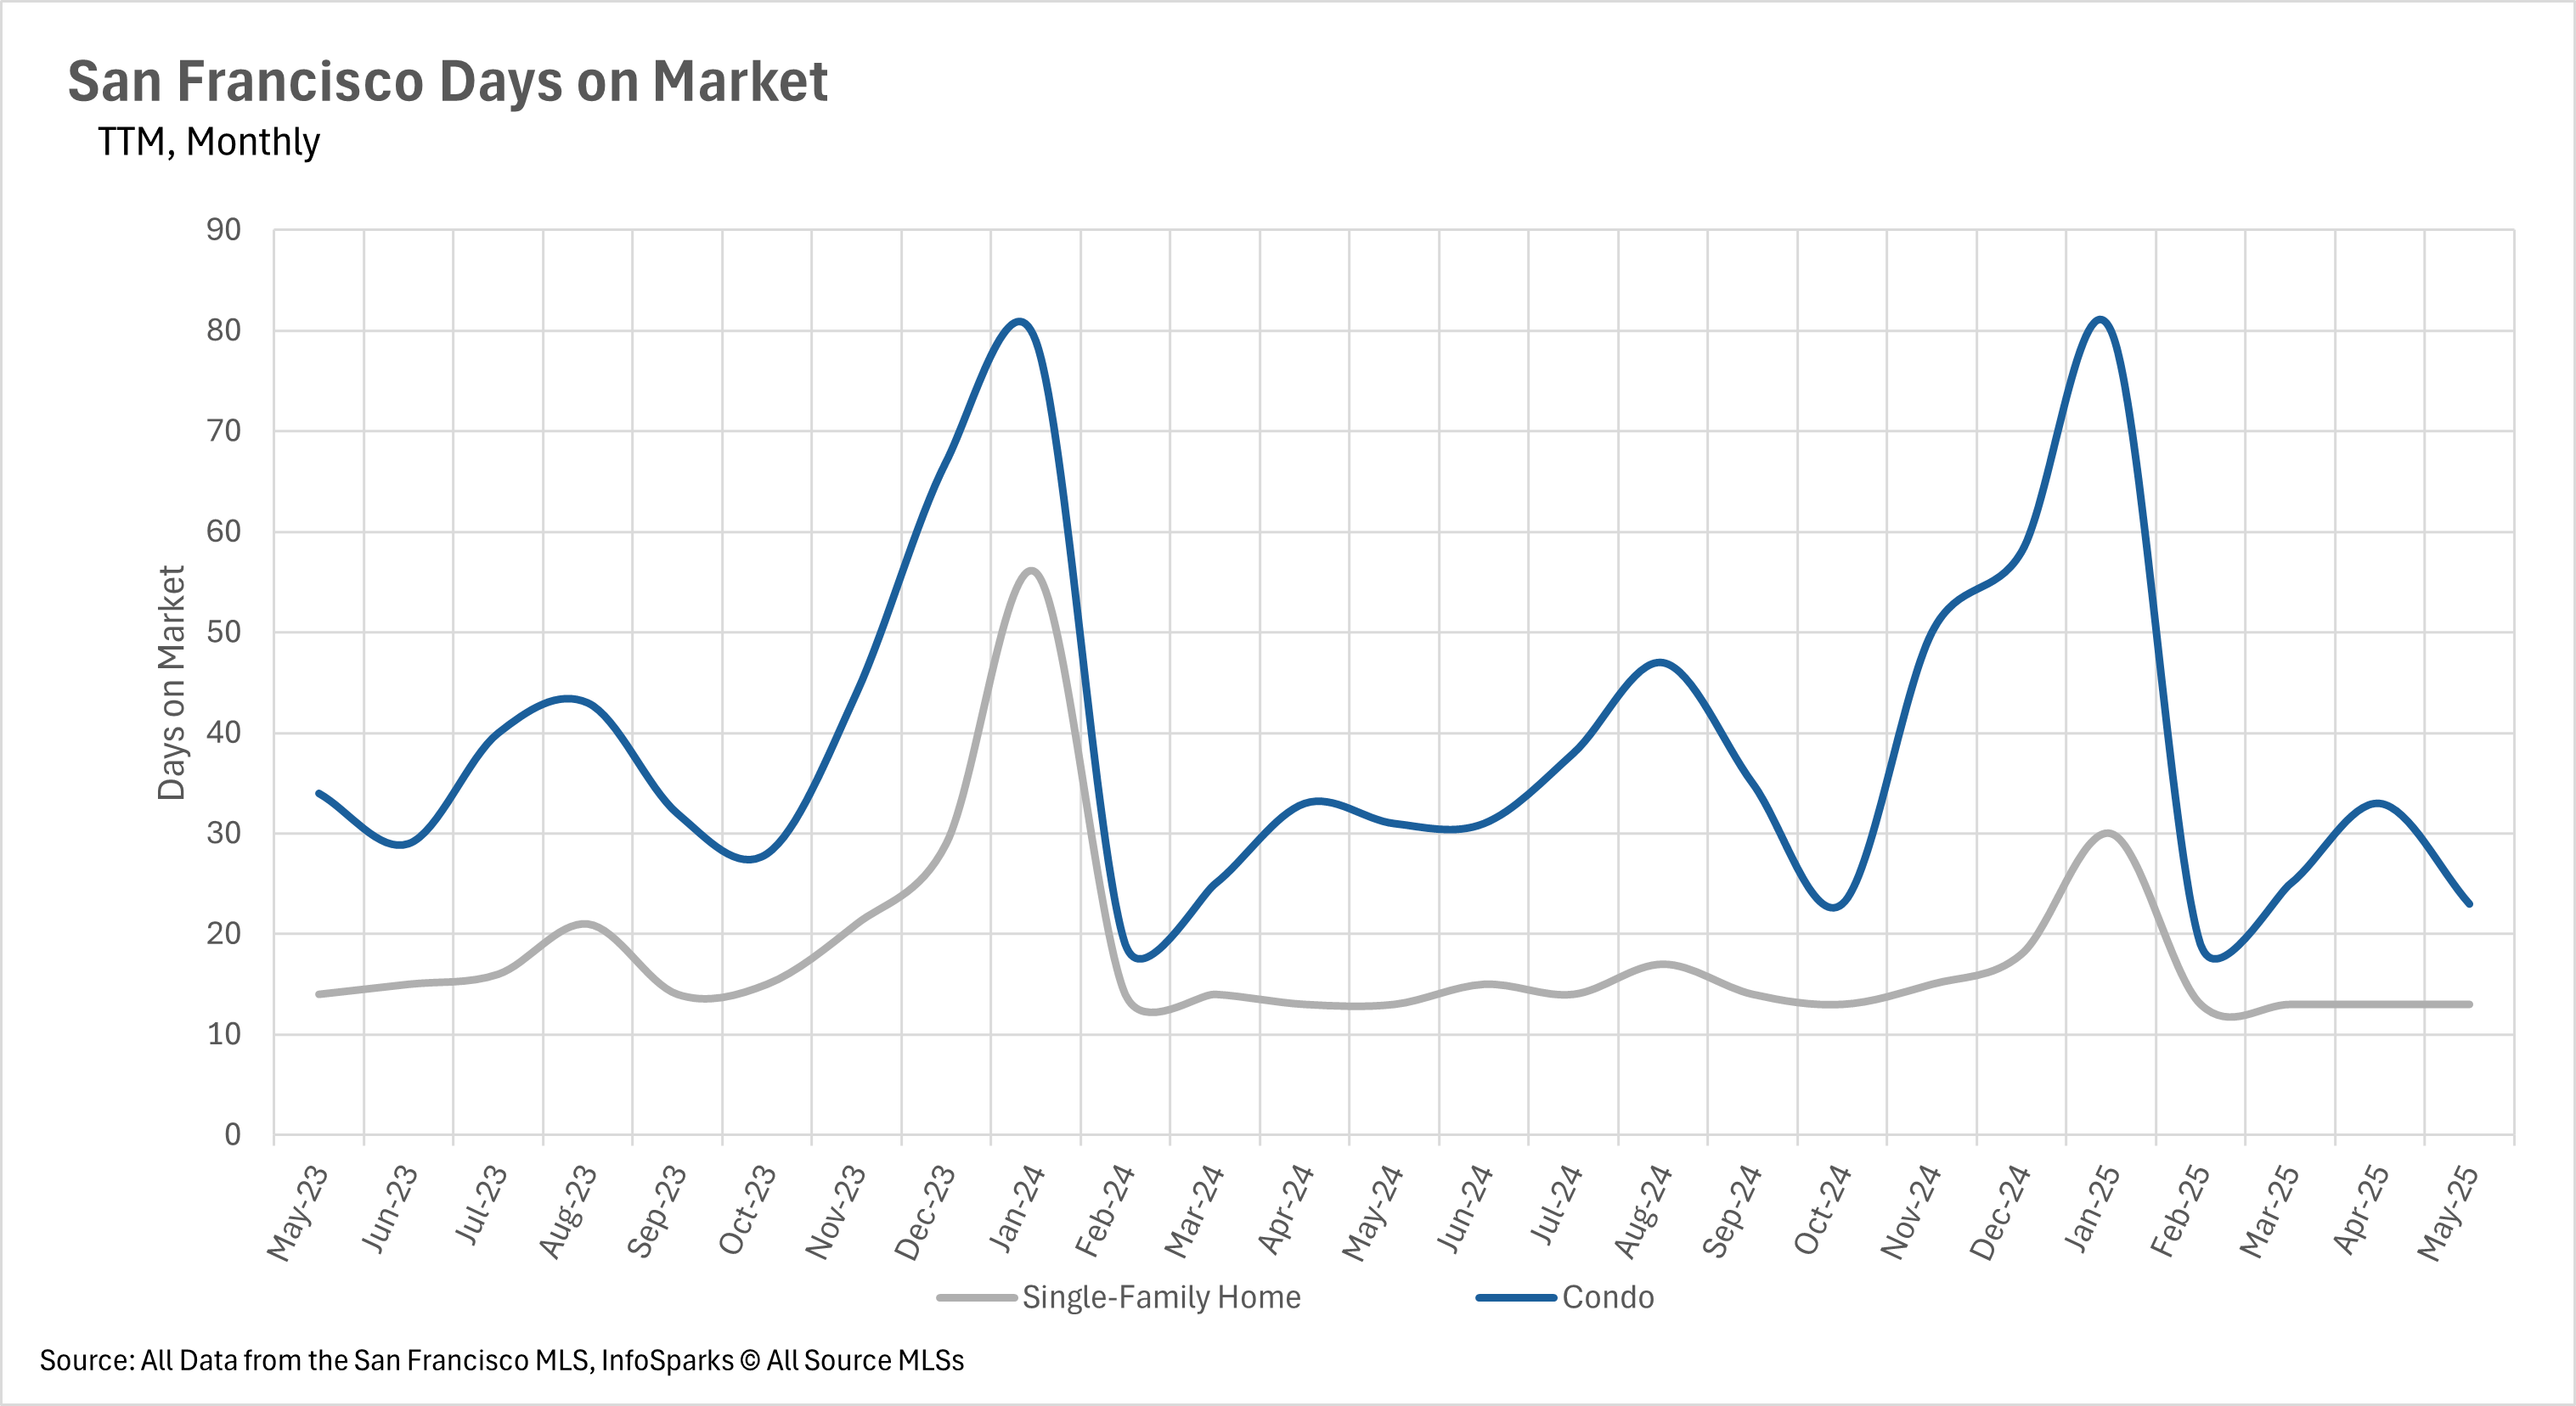
Listings are still being snapped up incredibly quickly

Since inventories have been trending lower, it’s probably not surprising to hear that listings are selling very quickly in San Francisco. The average single-family home lasts just 13 days on the market, which is exactly how long it took for a listing to sell around this time last year. Condos do take a bit longer to sell though, with the average condo sitting on the market for 23 days before it sells. This is still relatively fast, and this figure represents a 25.81% decrease from the 31 days on the market we saw last May!
The condo market remains a buyers’ market, while the single-family home market is a sellers’ market
When determining whether a market is a buyers’ market or a sellers’ market, we look to the Months of Supply Inventory (MSI) metric. The state of California has historically averaged around three months of MSI, so any area with at or around three months of MSI is considered a balanced market. Any market that has lower than three months of MSI is considered a sellers’ market, whereas markets with more than three months of MSI are considered buyers’ markets.
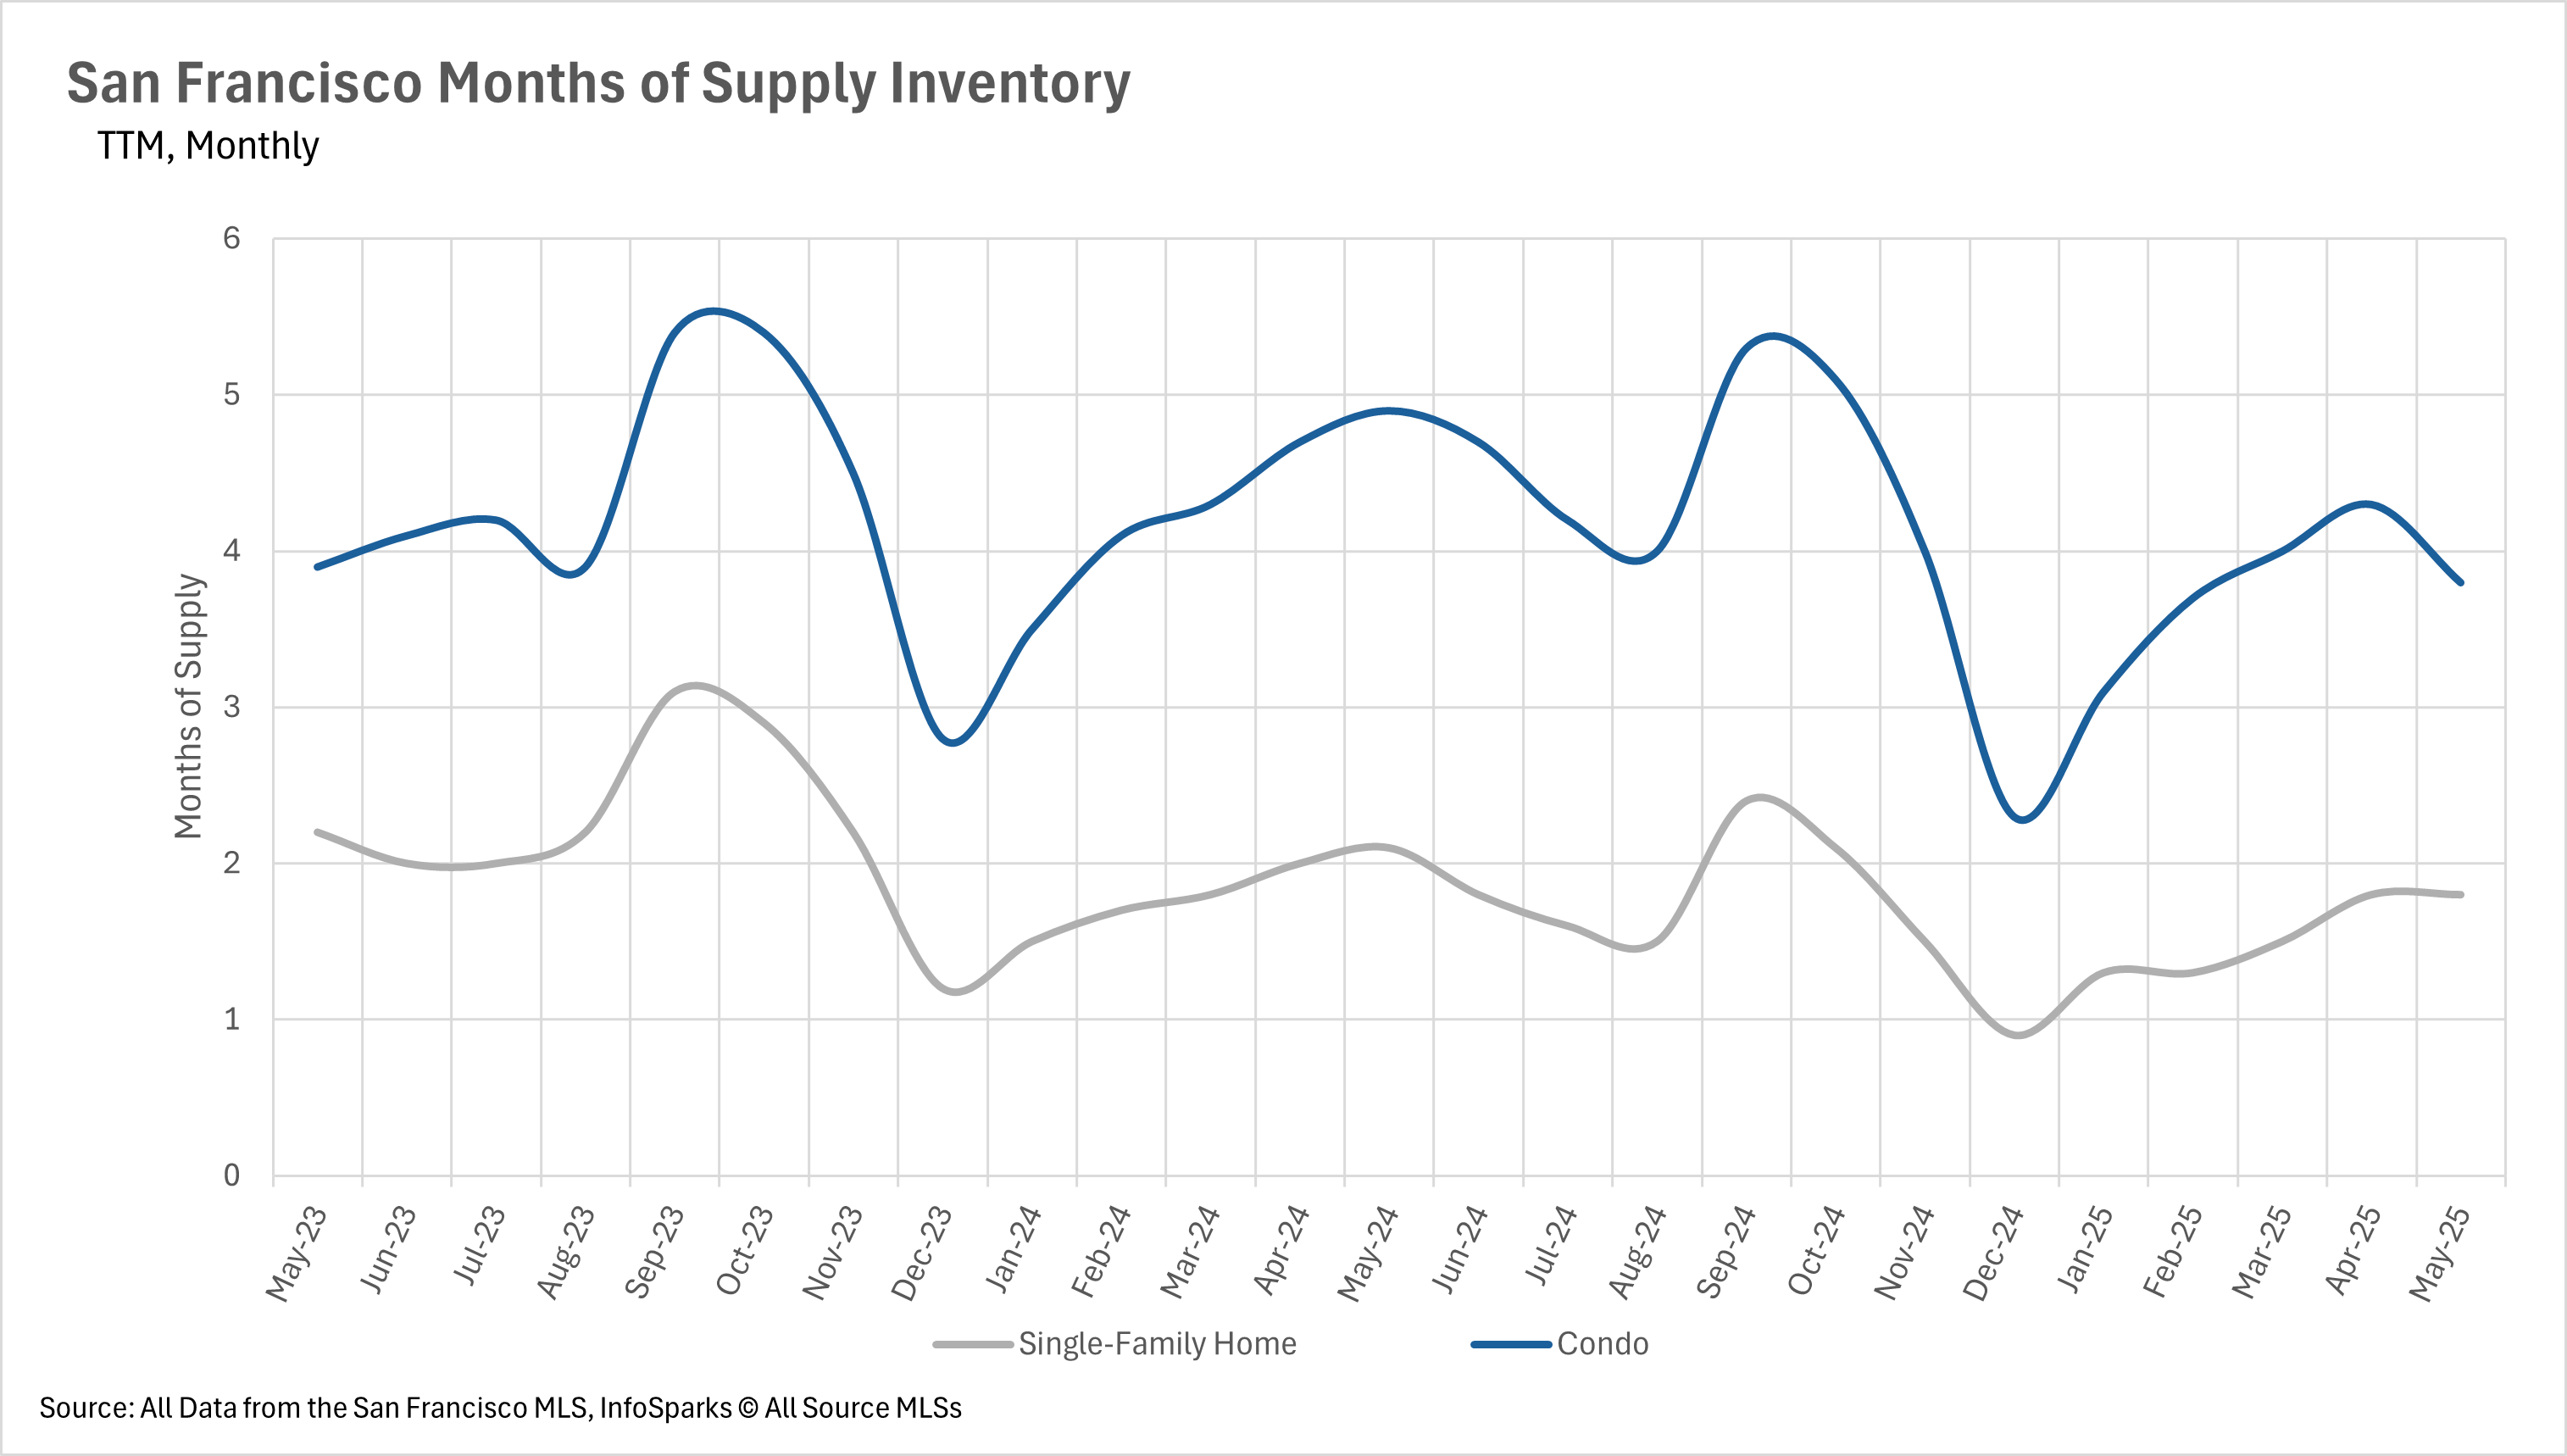
In San Francisco, the single-family home market has been a sellers’ market and the condo market has been a buyers’ market for quite some time. Although this month is no different, we did see some year-over-year declines in the number of months of supply on the market. The single-family home supply declined by 14.29% to 1.8 months worth of inventory, and the condo market declined by 22.45% to 3.8 months of inventory.
Want to know more? Our full report dives deep into the numbers. Follow us on social media @thefrontsteps for the latest market insights.
Thinking of buying or selling? Our team of experts can help you navigate the market. Contact us today for a free consultation!
Curious about market updates in other Bay Area areas? Click the button below for insights specific to the neighborhoods you’re interested in.