
Mid-May is here, and the San Francisco market is heating up, just not in all the usual ways.
Condo prices are finally moving in the right direction after months of slipping. We’re talking real year-over-year gains. On the single-family side, homes are still moving fast and getting plenty of attention, with overbids becoming the norm again.
Inventory is still a thorn in everyone’s side. Fewer listings mean more pressure on buyers and higher expectations for sellers. If you’re house hunting, you’ll need to come prepared. If you’re selling, price it right and make it shine or risk sitting on the market.
Quick Take:
- The sale price of the median condo has begun to uptick on a year-over-year basis, after several negative months.
- Inventory continues to be an issue for San Francisco, as the number of both single-family home and condo listings dips.
- There still aren’t any discounts to be found as the average listing continues to sell for over the original asking price!
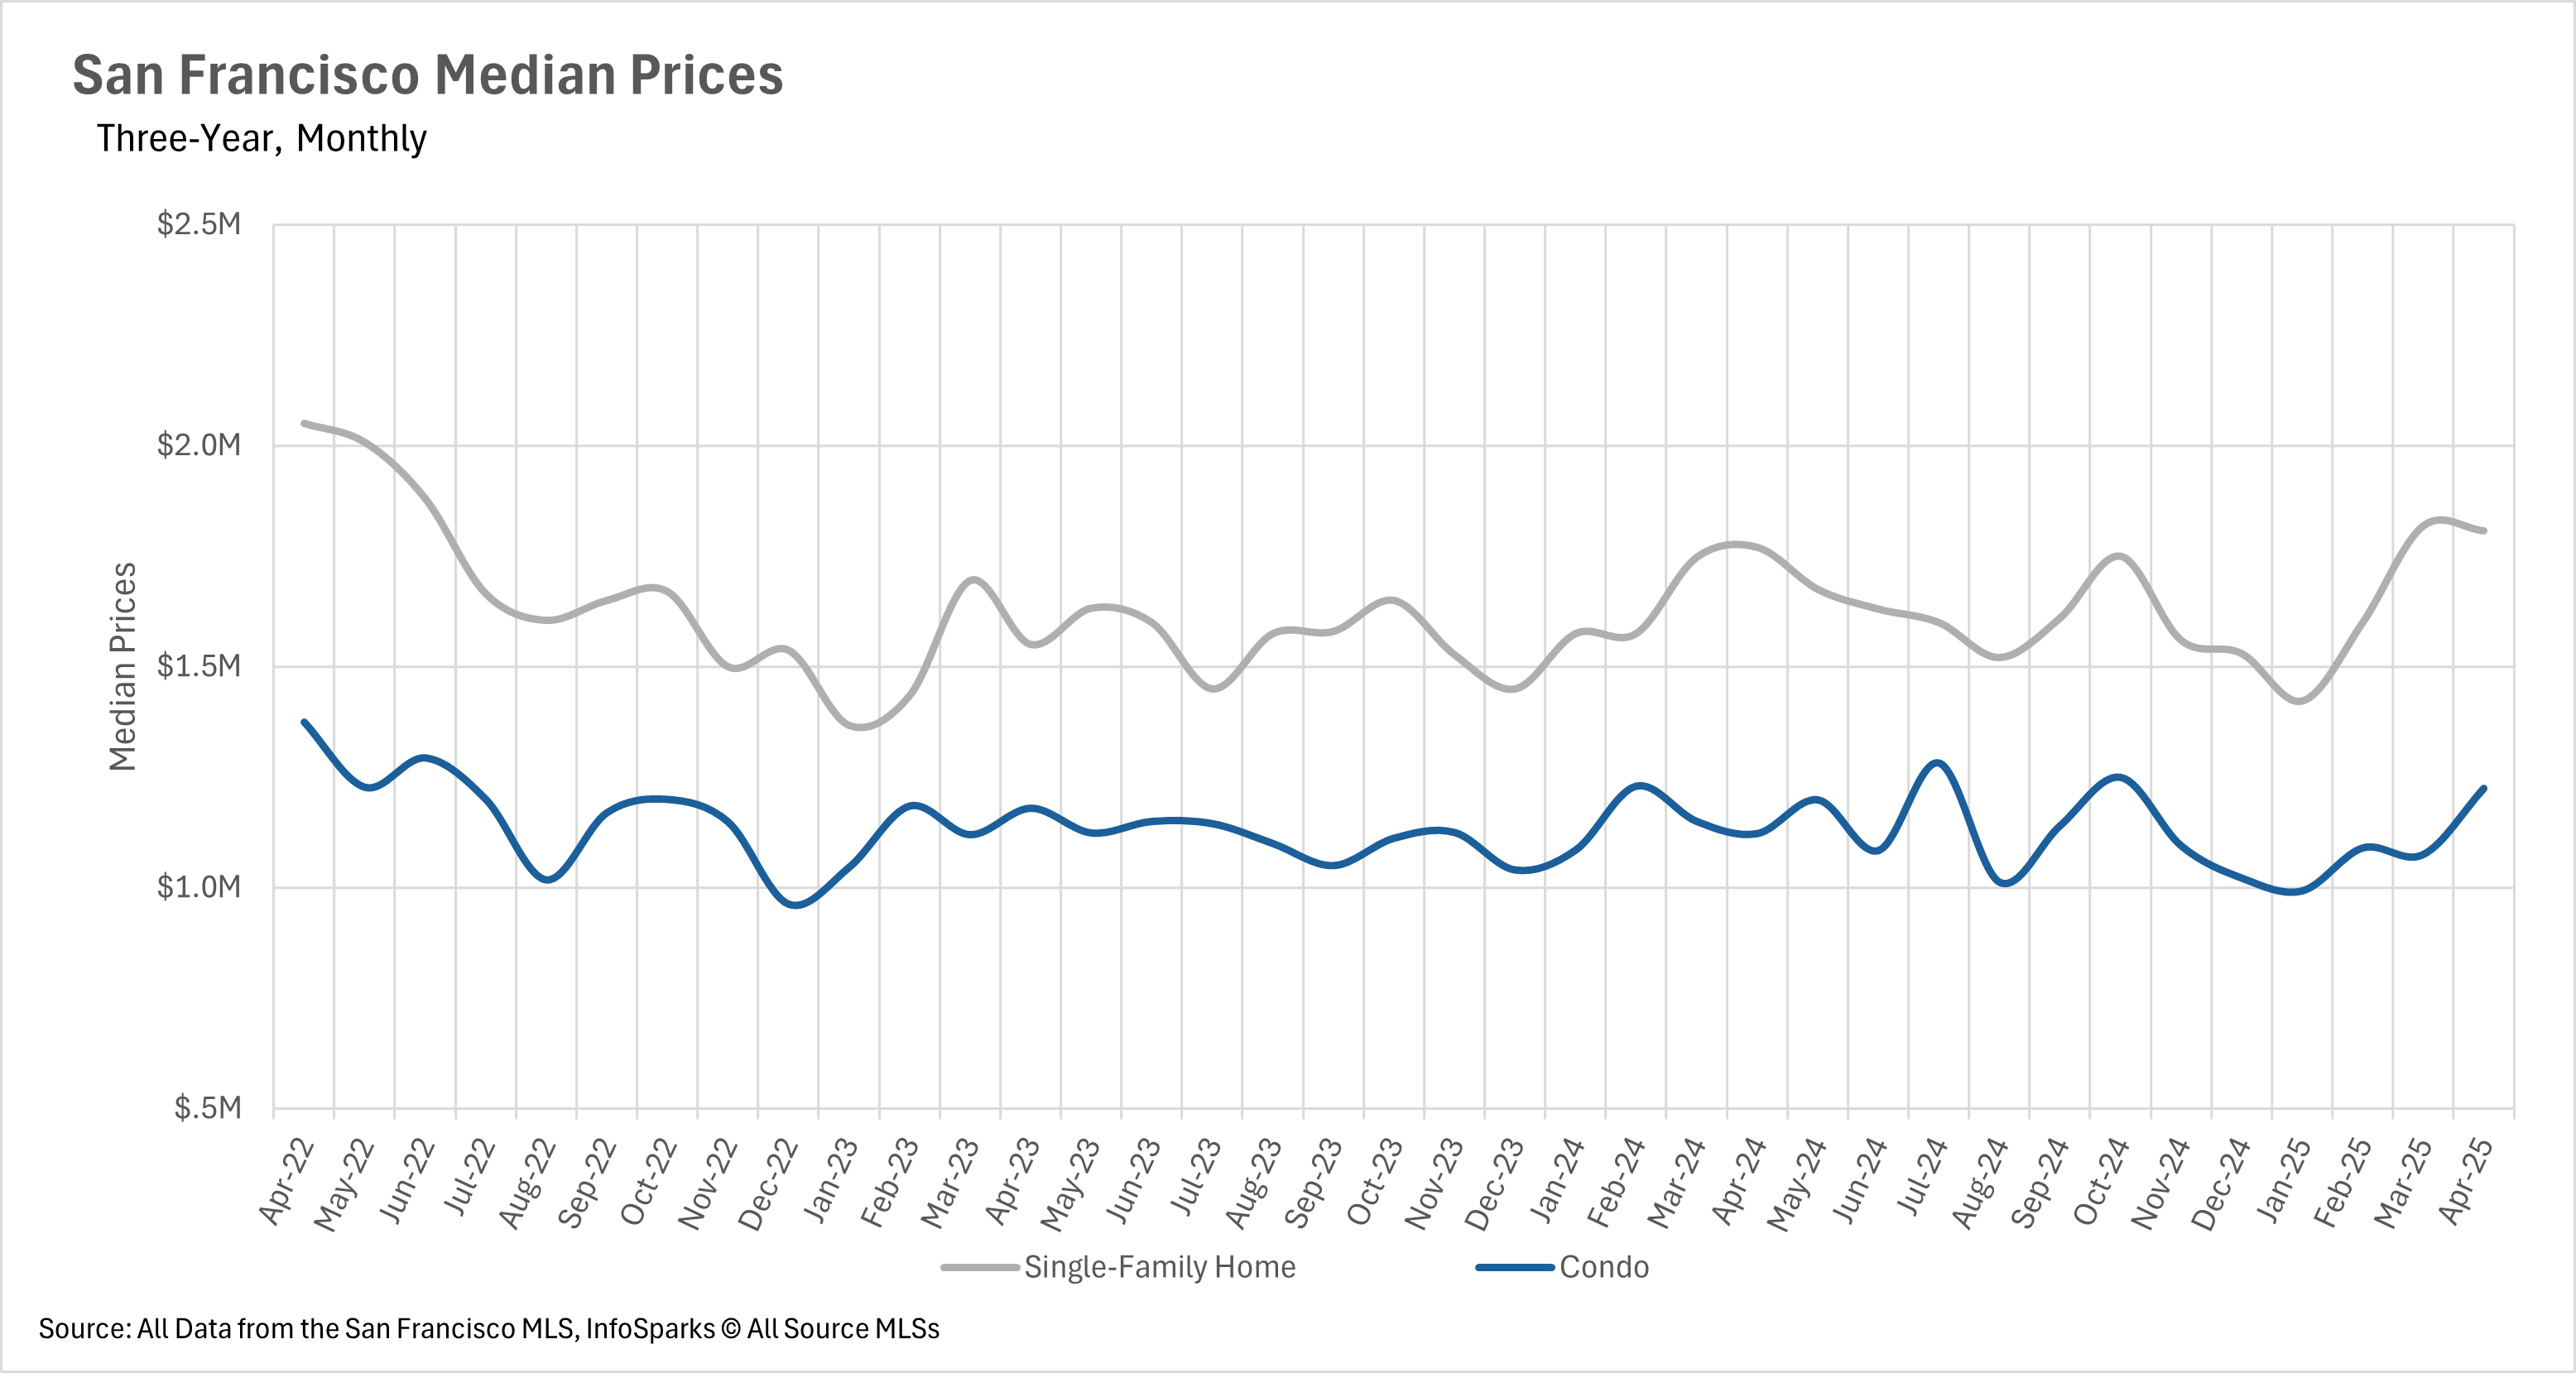
Condo prices are starting to tick back up!
For five months in a row, condo prices were declining on a year-over-year basis, but in the month of April, we actually saw some very strong growth in terms of condo median sale price! Condos in San Francisco are currently selling for around 9.13% more than this time last year. This could mark the turning point for the condo market in San Francisco! On the flip side, sale price growth for single-family homes remains steady, increasing by 2.12% in the month of April.

The inventory issue in San Francisco remains incredibly persistent


As we all know by this point, inventories have been declining in San Francisco for years now. Unfortunately, nothing has changed in the month of April, as the number of single-family homes on the market decreased by 6.29% on a year-over-year basis, and the number of condo listings on the market decreased by 7.52%. Notably, in the condo market, there was a 21.17% decrease in the number of sales on a year-over-year basis, which is one of the most substantial decreases we’ve seen in quite some time!
The average home is still selling for over the original listing price
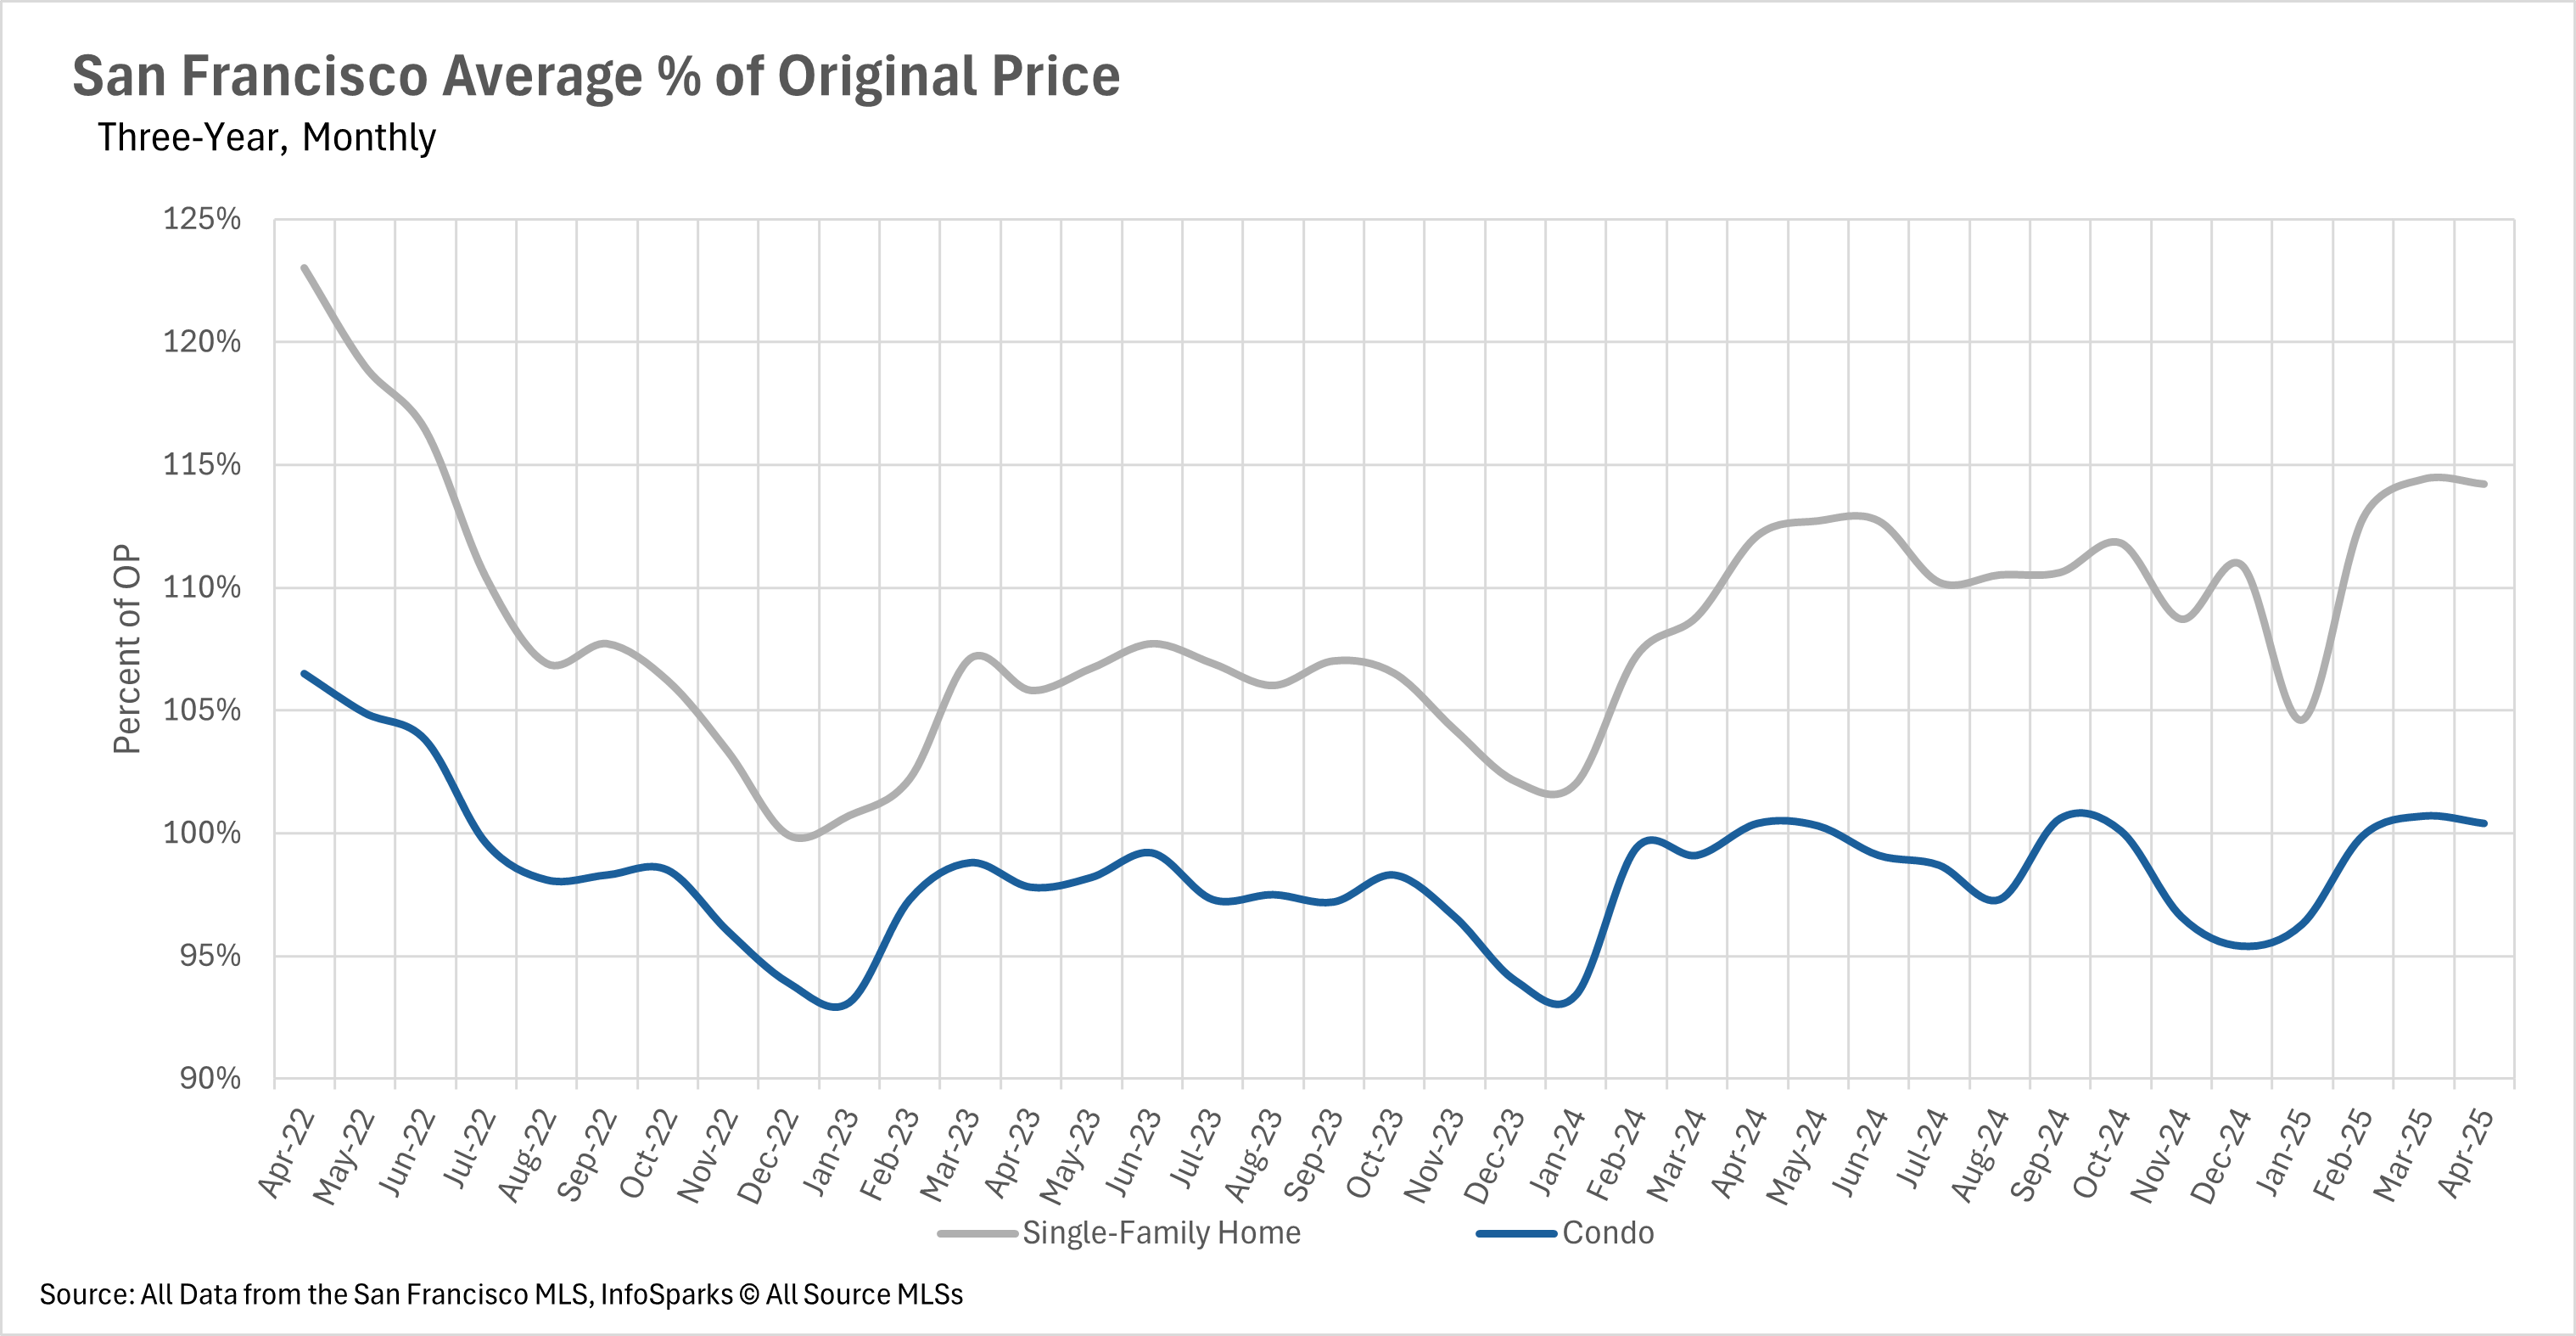
Unfortunately, if you’re looking to score a listing for below the asking price, you’re going to have to look very hard, as single-family homes are selling for 14.2% more than their original asking price on average. Fortunately, the condo market isn’t nearly as competitive, as the average listing sells for just 0.4% more than the original listing price.
Buyers vs. Sellers Markets
When determining whether a market is a buyers’ market or a sellers’ market, we look to the Months of Supply Inventory (MSI) metric. The state of California has historically averaged around three months of MSI, so any area with at or around three months of MSI is considered a balanced market. Any market that has lower than three months of MSI is considered a sellers’ market, whereas markets with more than three months of MSI are considered buyers’ markets.
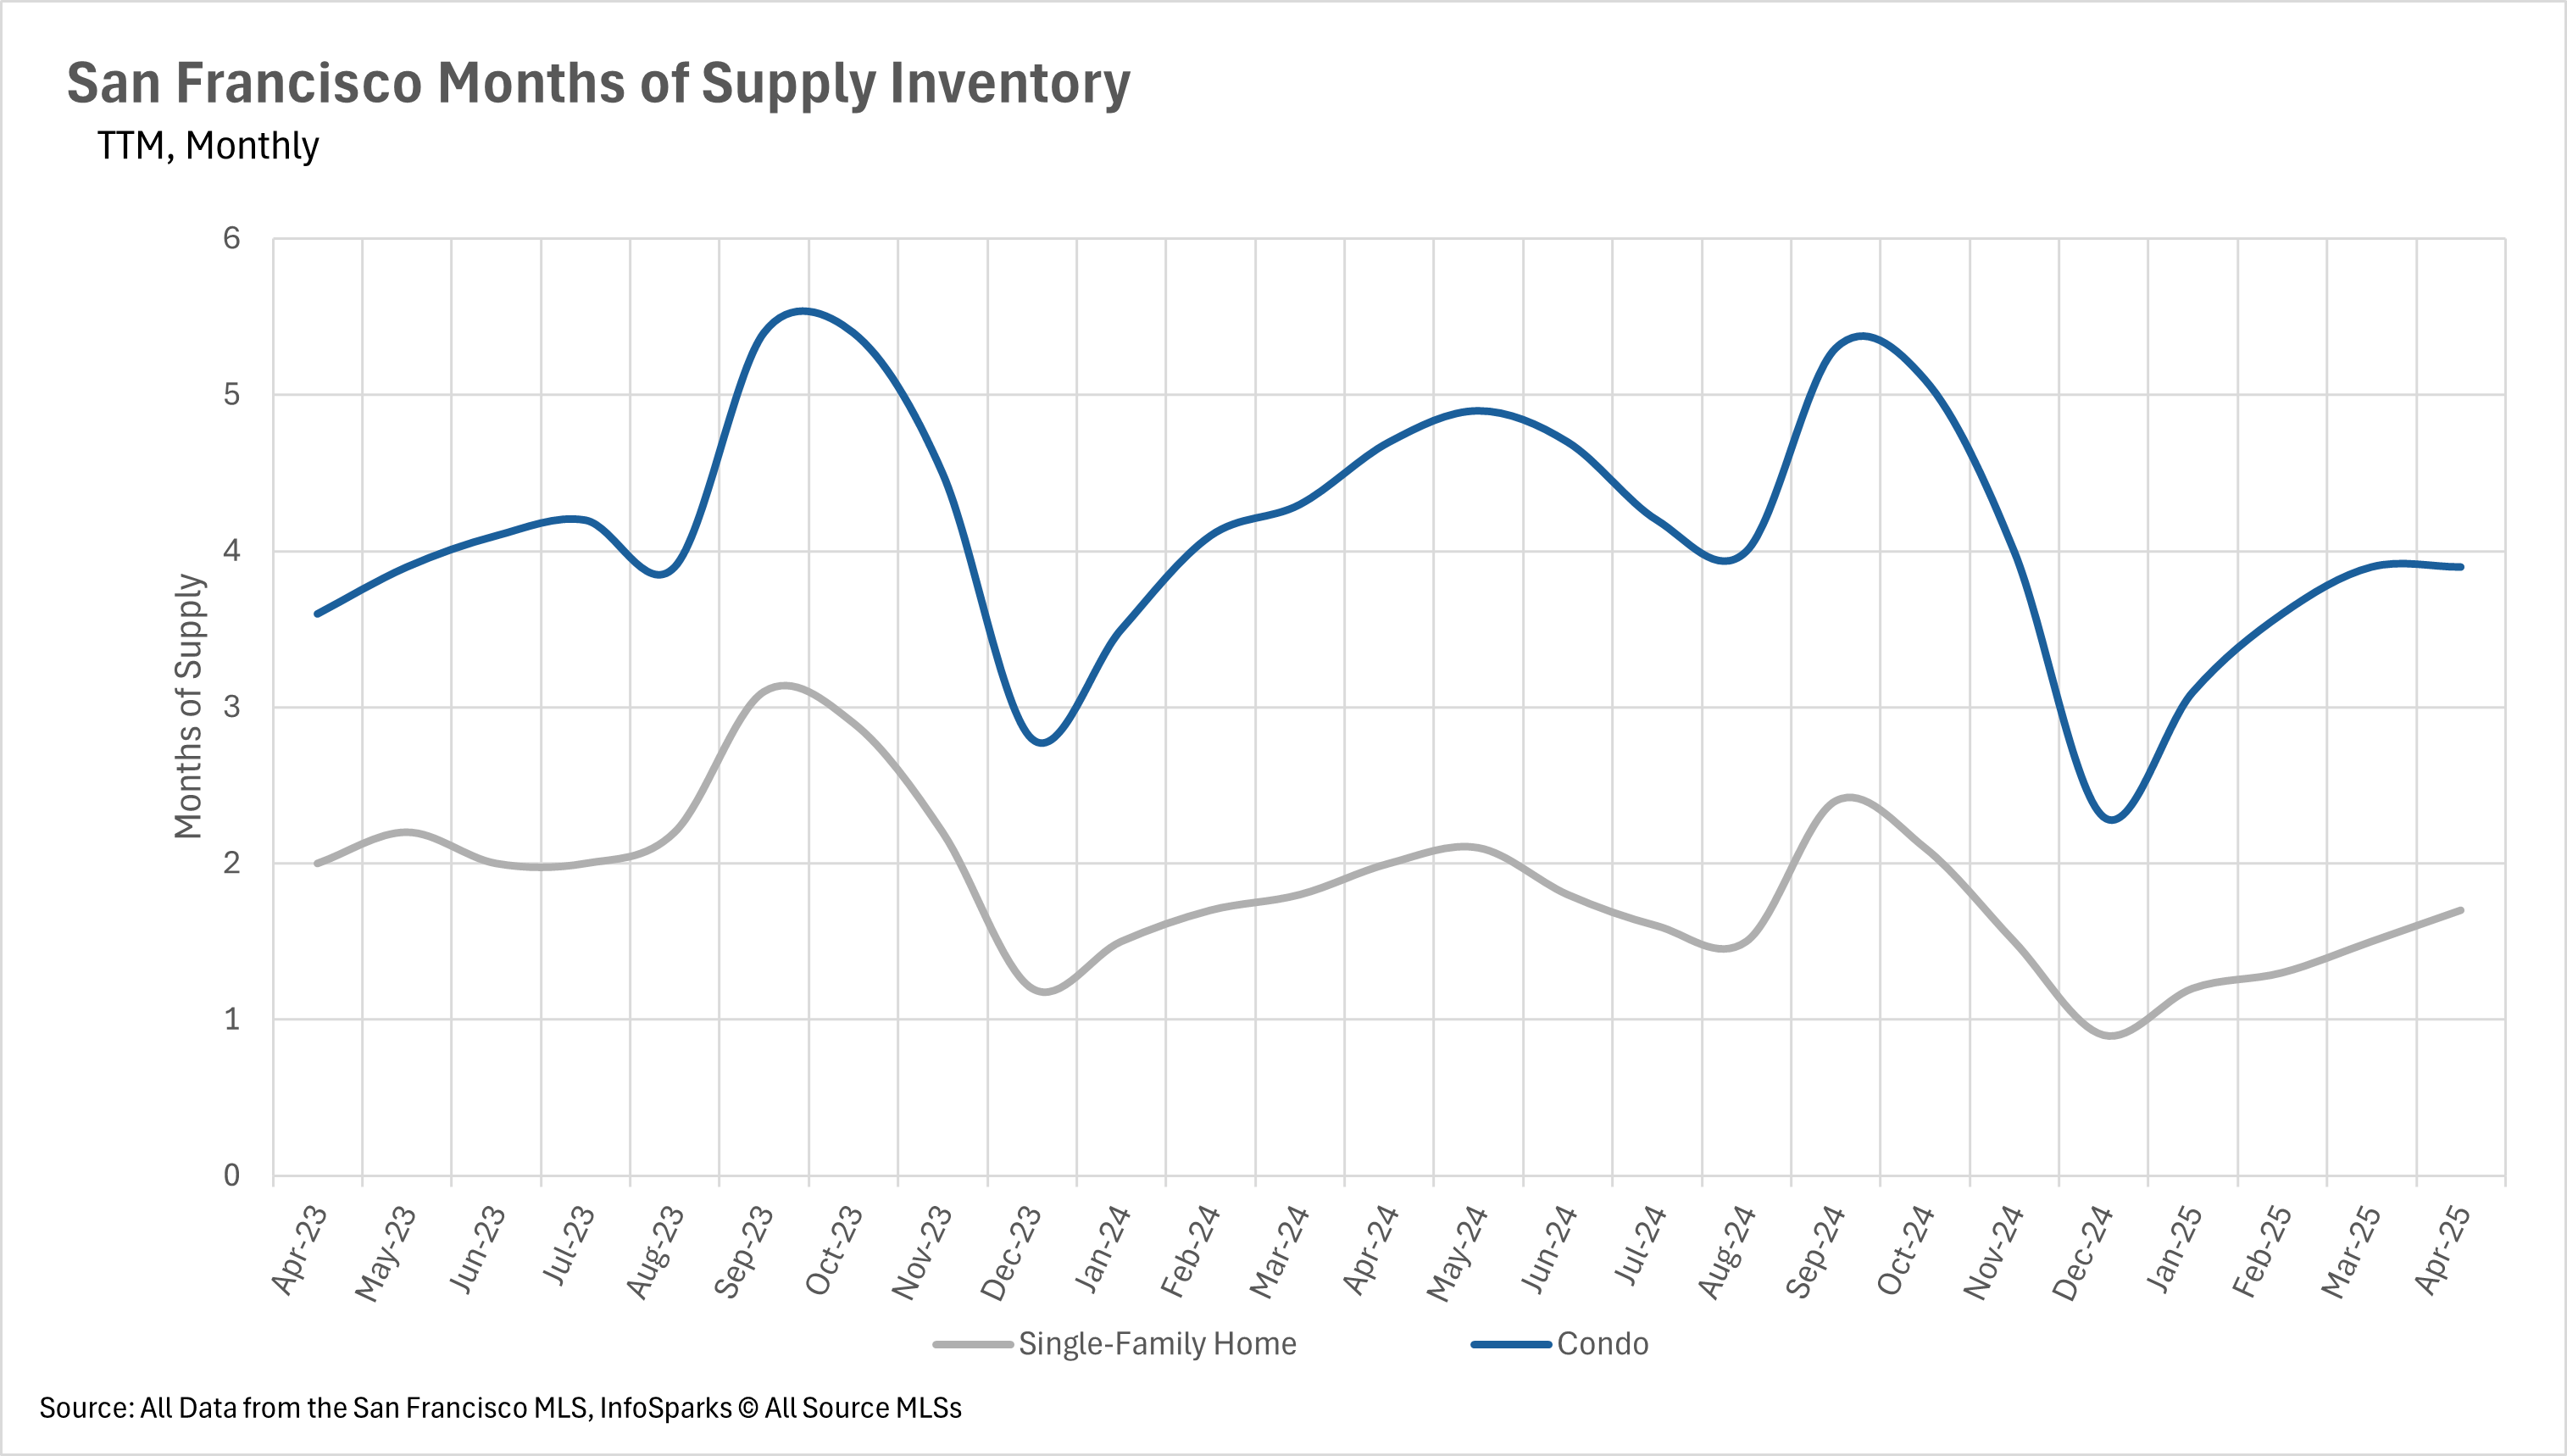
With inventories being such a huge issue, you might think that both the single-family home and condo markets are both seller’s markets. However, that’s not the case in San Francisco. The single-family home market remains a seller’s market, with just 1.7 months’ worth of supply on the market at this point in time. However, the condo market is a buyer’s market, as there are roughly 3.9 months’ worth of supply ready to buy on the market right now!
Want to know more? Our full report dives deep into the numbers. Follow us on social media @thefrontsteps for the latest market insights.
Thinking of buying or selling? Our team of experts can help you navigate the market. Contact us today for a free consultation!
Curious about market updates in other Bay Area areas? Click the button below for insights specific to the neighborhoods you’re interested in.