Everybody hates the vacancy rate in San Francisco, even though relatively few understand what that figure means.
The vacancy rate of course is the measure of the number of housing units currently without tenants. While that seems like a straightforward concept, in practice its ramifications are really quite diverse.
A huge amount of the sturm und drang around the vacancy rate assumes that every vacancy is a perfectly good, livable home that’s just sitting dark and empty for no reason at all–which is actually rarely the case.
Ordinarily, our primary and sole source for vacancies is an estimate provided by the US Census. But now the SF-based rental platform ApartmentList is stepping up with a raft of new information measuring vacancy rates in SF going back to 2017.
On one hand, that’s potentially incredibly useful.
On the other hand: Oh god, what have they done? Do they have any idea what they’ve done?
Let’s see what the damage is.
Just The Numbers
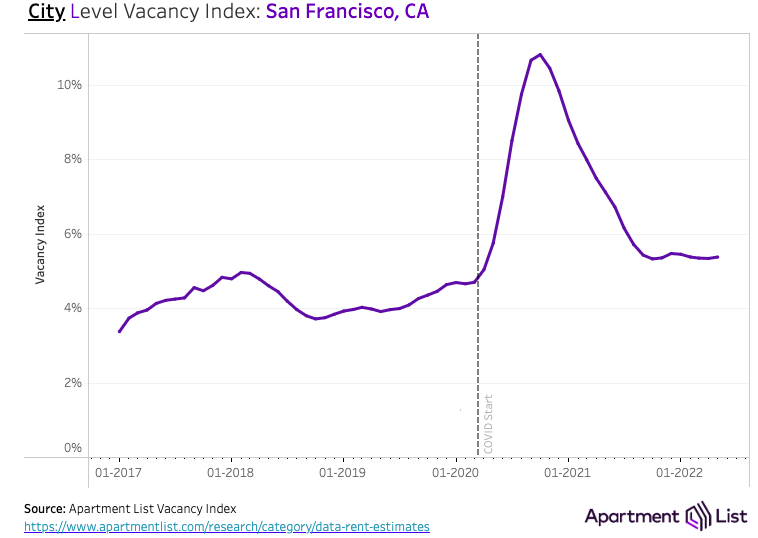
The data itself is apparently straightforward: Starting in January of 2017, the site estimates a 3.37 percent apartment vacancy rate in the city.
According to the SF Housing Inventory, in 2017 the city had about 266,586 housing units in buildings with two or more homes. So a one percent vacancy would add up to about 2,665 apartments (give or take), IF ALL OF THOSE UNITS WERE ON THE RENTAL MARKET…which of course is a pretty big “if.”
By January of 2020, that was up to 4.69 percent. And then the rate shot through the roof, as high as 10.82 percent in October of that year, which of course makes perfect sense with everything else happening in the city at the time.
That number dumped back down to 5.32 a year later, and now sits at just barely more than that. Per the 2021 Housing Inventory, the current rate of 5.37 is (potentially) around 15,300 homes.
This means that in all likelihood, your social media will in the near future be filled with the alarming news that “over 15,000 San Francisco apartments are going to waste.”
But of course, this is not quite what the data really means.

Just The Facts
For starters–and we have bent over backwards on this point many times before–only a handful of “vacant” homes are actually empty in the sense that people imagine. For more on that, see all the gruesome details here.
Also likely to go unexamined is how ApartmentList’s number crunchers came by these figures:
“For every property on our platform, we know the total number of units in the building, as well as the number that are vacant on any given day. […]Our monthly vacancy index for a given location is calculated by taking an average of the daily vacancy rates for each property and then averaging the rates of all the properties” across the city.
In short, if the number and kind of homes on ApartmentList are strong representation of homes in SF in general, then this rate is a useful metric.
If not, then it’s only an accurate measure of certain kinds of rental homes–the kind likely to be on ApartmentList. Which is also useful, but critically not the same thing.
Of course, the site’s statisticians are not stupid, so they try to correct for this bias in a number of ways. However, the index warns, “our sample of properties is heavily skewed toward large multi-family apartment complexes, generally containing 50 units or more per property.”
In 2021, units of 20 or more made up only 31 percent of SF’s housing stock; there is no specific measurement of developments with 50-plus units.
So what does it all mean? The same thing housing data means every time we put it in front of you: These numbers are revealing, but what they reveal is rarely what we assume at first glance. Or what other people are trying to tell you. Stay sharp.
As always, if you have any questions you can contact us directly, or throw them in the comments below. Make sure to subscribe to this blog, or follow us on social media @theFrontSteps too. And please do consider giving us a chance to earn your business and trust when it’s time to buy or sell Bay Area property. People like working with us, and we think you will too.