Case-Shiller Index numbers all reflect home prices as compared to the home price of January 2000, which has been designated with a value of 100. Thus, a reading of 180 signifies home prices 80% above those of January 2000.
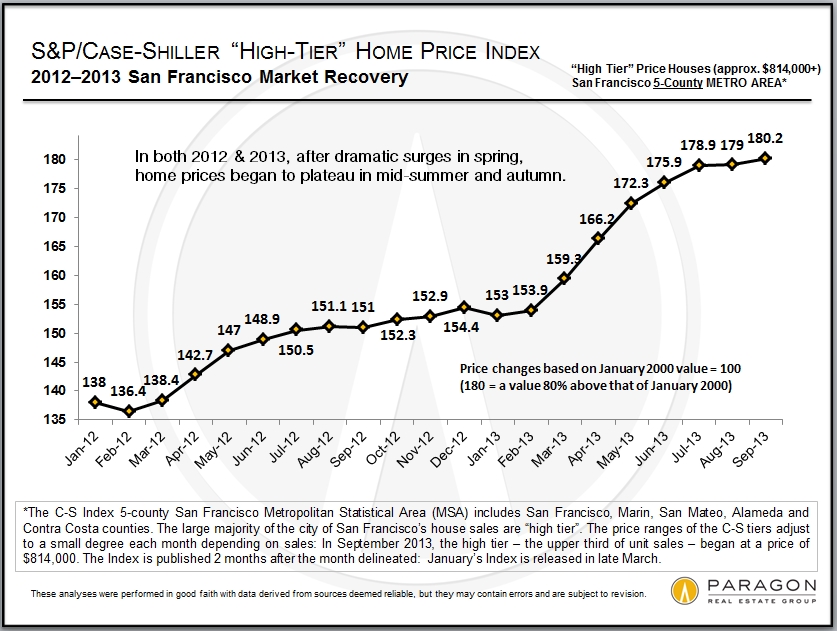
The Case-Shiller Index for the San Francisco Metro Area covers the house markets of 5 Bay Area counties, divided into 3 price tiers, each constituting one third of unit sales. Most of the city of San Francisco’s house sales are in the “high price tier.” The Index is published 2 months after the month in question and reflects a 3-month rolling average. September’s Index was just released November 26th.
This chart illustrates the price recovery of the Bay Area high-price-tier home market which really got under way in 2012. In both 2012 and 2013, home prices surged in the spring and then plateaued in the summer-autumn. The surge in prices that occurred in spring of 2013 was particularly dramatic, reflecting a frenzied market of huge buyer demand, historically low interest rates, increasing consumer confidence and extremely low inventory. In San Francisco itself, it was further exacerbated by the high-tech-fueled explosion of new wealth. The market has since calmed down somewhat and that cooling is reflected in the Index readings of the past three months (through September).