


Welcome to the start of 2025, where the housing market is already keeping us on our toes. The holidays may be behind us, but the new year brings fresh opportunities and challenges in real estate. With elevated rates and limited inventory, buyers and sellers alike are learning to navigate this ever-changing market.
For buyers, the market may feel tighter, but January is often a great time to find motivated sellers. If you’re eyeing a home, this could be your chance to make a move before the spring competition heats up.
For sellers, fewer homes on the market mean you’ve got less competition. If you’re ready to sell, strategic pricing and preparation are key to capturing buyers’ attention now.
This month’s newsletter digs into the current state of the market, what’s happening with rates, sales trends, and why inventory feels like it’s playing hard to get. If you’re thinking about buying, selling, or just curious about where the market might head next, I have all the updates for you.
Let’s kick off the year with confidence. Here’s to making 2025 the year you reach your real estate goals!
Quick Take:
- The median home price fell 2.5% month over month, while condo prices declined 4.3%. We expect prices to contract in January 2025 before rising into the spring.
- Total inventory fell 50.9% month over month, dropping inventory to a record low. We expect inventory to continue to decline in January and the overall market to slow due to lack of supply.
- Months of Supply Inventory plummeted in Q4 2024 due to the lack of inventory. Currently, MSI indicates a strong sellers’ market for both single-family homes and condos.
Median home prices declined month over month, but rose slightly for the year

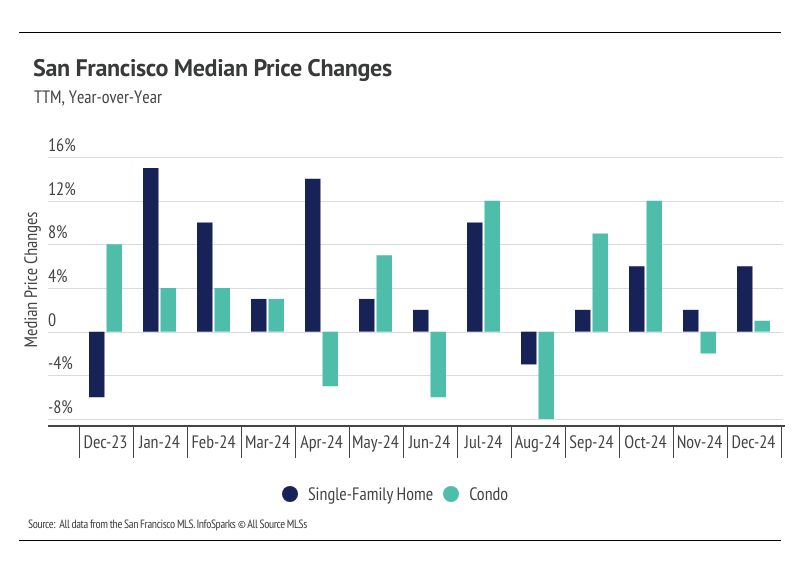
In San Francisco, home prices haven’t been largely affected by rising mortgage rates after the initial period of price correction from April 2022 to August 2022. Single-family home prices peaked at $2.05 million in April 2022 as mortgage rates rose rapidly; $2 million homes are simply far more affordable with a 4-5% mortgage than a 6-7% mortgage. Because of the relatively high prices of homes in San Francisco, prices had to come down to keep buyers in the market. Since August 2022, the median single-family home and condo prices have hovered around $1.6 million and $1.1 million, respectively. In December, prices were almost exactly in line with those averages. Year over year, the median price was up 5% for single-family homes, but down 1% for condos. Inventory is once again at a record low, so rising supply only increases prices as buyers are better able to find the best match.
High mortgage rates soften both supply and demand, but homebuyers and sellers seemed to tolerate rates near 6% much more than around 7%. Mortgage rates fell significantly from May through September, but rose significantly in the fourth quarter of 2024. Now, rates are far closer to 7% than 6%, so we expect sales to slow further.
Sales far outpaced new listings in December, dropping inventory to all-time lows


Total inventory has trended lower essentially since 2010, but active listings fell precipitously from October 2020 to December 2021, as sales outpaced new listings, before stabilizing to a degree from January 2022 to the present at a depressed level. New listings are simply not coming to market, and sales have more than offset any new listings. Low inventory and new listings, coupled with high mortgage rates, have led to a substantial drop in sales and a generally slower housing market. Typically, inventory begins to increase in January or February, peaking in July or August before declining once again from the summer months to the winter. In 2023, sales didn’t resemble the typical seasonal inventory peaks and valleys. It’s looking like 2024 inventory, sales, and new listings will follow historically seasonal patterns, albeit at a depressed level. Supply will remain tight until spring 2025 at the earliest.
In December, sales far outpaced new listings, causing inventory to decline by 51%. Compared to last year, however, new listings are up 16%, which contributed to the year-over-year increase in sales, up 8%.
Months of Supply Inventory in December 2024 indicated a sellers’ market
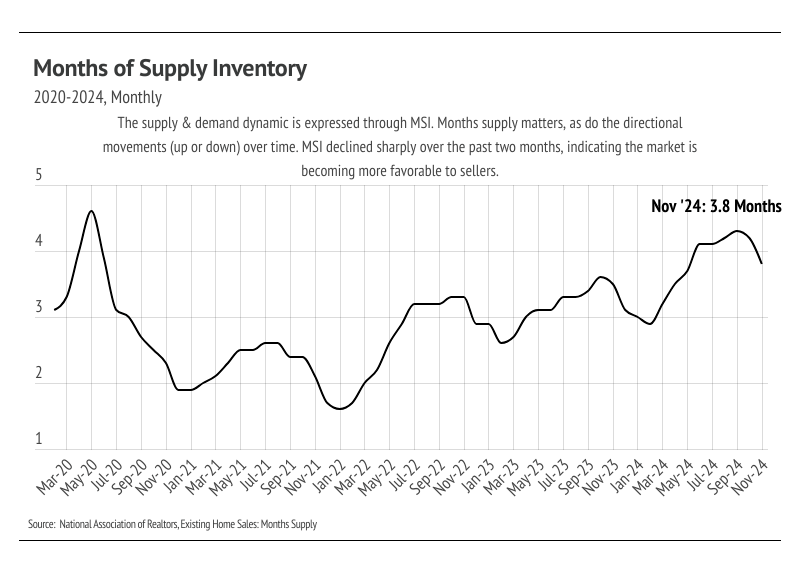
Months of Supply Inventory (MSI) quantifies the supply/demand relationship by measuring how many months it would take for all current homes listed on the market to sell at the current rate of sales. The long-term average MSI is around three months in California, which indicates a balanced market. An MSI lower than three indicates that there are more buyers than sellers on the market (meaning it’s a sellers’ market), while a higher MSI indicates there are more sellers than buyers (meaning it’s a buyers’ market). The San Francisco housing market tends to favor sellers, which is reflected in its low MSI, at least for single-family homes. MSI has been below three months since October 2023 for single-family homes. From May to August, MSI declined meaningfully. In September, MSI jumped higher as new listings spiked. However, in Q4, sales outpaced new listings and inventory dropped, which in turn caused MSI to fall. The current market strongly favors sellers.
Want to know more? Our full report dives deep into the numbers. Follow us on social media @thefrontsteps for the latest market insights.
Thinking of buying or selling? Our team of experts can help you navigate the market. Contact us today for a free consultation!
Curious about market updates in other Bay Area areas? Click the button below for insights specific to the neighborhoods you’re interested in.