What an interesting Summer! We are still in the midst of a hot real estate market where homes are getting quickly snatched up, buyers are stretching to pay over asking. The recent stock market gyration and Chinese currency devaluation add some uncertainty to the economy, and later this month the Fed is going to tell us where interest rates might go, but the San Francisco real estate market is steaming along.
The Housing Affordability Index (HAI), an index released periodically by the California Association of Realtors to measure the percentage of households that can afford to buy the median priced single family dwelling, shows all Bay Area counties saw declines in their affordability index reading, and San Francisco is now only 2 percentage points above its all-time low of 8%, last reached in Q3 2007.
The median house price, mortgage interest rates, and household income are the 3 major factors affecting the Housing Affordability Index. A picture is worth a thousand words, so here are the graphs:


Interest rates play a huge role in affordability, and it is certainly reasonable to be concerned that affordability percentages are now hitting such depths while interest rates are also close to historic lows. For example, in 2007, when affordability percentages hit previous low points, prevailing mortgage interest rates were approximately 50% higher than today’s. When interest rates start to rise – when and how much being the real questions – there will be potentially dramatic effects on affordability, which could presumably affect demand and prices.

As the HAI is approaching the record low, don’t hit the panic button yet. I’d like to show a unique perspective from John H Dolan, the sole market maker for the Case Shiller home price futures contracts that are traded (very infrequently) on the Chicago Mercantile Exchange.
San Francisco home prices have been rising sharply but how much higher might they run? Are they in a bubble? When, and how, will we know? Homeowners want to stay on top of expectations, while potential home buyers don’t want to see the market run away from them. While there may be many opinions, there is also one public market that home owners and buyers can access, to see what the market “thinks”.
The CME (Chicago Mercantile Exchange) has listed futures contracts for a number of the Case Shiller indices, including San Francisco (SFR), since 2006.^1 Essentially, the contracts allow participants to either view, or place a bet, on where the Case Shiller SFR index will be at various points over the next few years.^2 Since these housing contracts cash-settle on the value of the index in the settlement month (much like the S&P 500) it has been argued that traders may be “betting” on where they expect the index to be.^3 People can freely view the contract prices as a component of their own home price forecasts.^4
The graph below shows both the historical Case Shiller SFR index (in black), bids (blue axis), offers (red pluses), and contract closes (in purple). Finally contract values for Dec ’14 are shown in red.
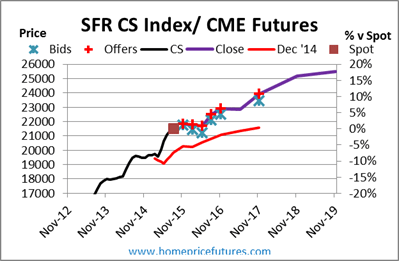
There are sets of 11 contracts (one for the Case Shiller 10-city index, and one for each of the ten components. San Francisco (SFR) is one of those ten.) While index levels react more slowly, and are backward looking, contract prices can change daily. While forward prices have been rising over the last few years on better-than-“expected” home price gains (at least as expected by this market), contract prices (particularly longer-dated expirations) have fallen this month.
While the SFR home price index has nearly doubled over the last five years (from a low of 117.42 in May 2009 to 214.53 this month), forward market prices are consistent with much more muted gains in 2016 and 2017. For example the 225.0 bid and 229.0 offer on the Nov ’16 contract are 4.9% and 6.7% above today’s level. The Nov ’17 contract is priced for an additional 4.3% gain the following year.
As such, expect headlines to note the slowdown in SFR home price appreciation (HPA) over the next year.
While contract prices for Nov ’16 and ’17 are higher than where they were at Dec ’14, they are off 4-5 points in the last few weeks as news of the Yuan devaluation and stock market gyrations have dampened expectations. The recent decline in prices is indicative that futures contracts are not predicators of the future, but reflective of expectations (that change as news occurs). That is, just as prices for oil futures dropped $50 in the last year as expectations changed, home price futures contracts also move.
In addition to just viewing bids and offers, those that either want to hedge an exposure (or future purchase), or who have a strongly different view of forward index levels can trade contracts to lock in forward prices. For example, someone thinking that SFR index levels will be lower by Nov 2016 might look at selling Nov ’16 contracts, while someone expecting another 10% annual gain might prefer to buy contracts.
Contracts have notional value of $250 * index price, so at a price of 225.0, the notional value is $56,250. A one point move in the futures price (e.g. from 225 to 226) is worth $250.
A trader would have to have a futures account, but the CME would be the legal counterparty to any trade. Margins tend to be less than 10% of the notional value.
As such, someone with a more bullish outlook in 2014, or someone looking to buy a house in 2015/16, could have (hypothetically) bought Nov ’16 SFR futures near 198 (mid-market price that day). With the contract 225 bid today, the buyer wouldíve made $6,750/contract
The contracts have been extremely thinly traded (e.g. there was only one SFR contract traded last month) so caution and patience are important. The markets are often quoted 1×1 (one contract bid/ one contract offered) so market orders for more than one contract are discouraged. The market-maker has expressed willingness to trade larger size, so best to contact him for larger orders.
Finally, contracts are traded on the SFR index which covers a wide area. Prices in any one neighborhood might diverge from the overall index levels. In addition, there’s (of course) no hedge for over-paying for a house.
Net, CME Case Shiller home price futures offer a useful tool for forecasters in framing their housing outlook. Unlike surveys, prices are continually updated, and traders are putting their money behind their bids and offers. The current thinness (limited trading) of the market suggests that CME prices might be one tool (but not the only) that homeowners can use to see what the market “thinks” about where home prices are headed.
1-For those new to home price indices, the Case Shiller index is the grand-daddy of home price indices. The indices were originally introduced in the early 1990’s by Nobel Laureate Robert Shiller and Carl Casein, and remain one the oldest that are currently being used. CS indices are often cited in news reports and in the financial press (e.g. CNBC). The CME has contracts for the Case-Shiller 10-city index (CUS) and, in addition to SFR, each of the other 9 components: (BOS, CHI, DEN, LAV, LAX, MIA, NYM,SDG, and WDC).
2- There are 11 expirations that today range from Nov 2015 to Nov 2019 (although some contracts do not often have posted prices).
3- Case Shiller indices are released on the last Tuesday of every month
4- e.g. Bloomberg
Big thanks to John H Dolan for the information, and new point of view! Visit HomePriceFutures.com for more analysis on home price derivatives.
That’s it. My head is spinning.