My company just put out some heavy duty data crunching that can shed some light on this recent housing boom. I have put the entire report below. Enjoy and share.
30 Years of Housing Market Cycles in San Francisco
Updated Report
Below is a look at the past 30 years of San Francisco Bay Area real estate boom and bust cycles. Financial-market cycles have been around for hundreds of years, all the way back to the Dutch tulip mania of the 1600’s. While future cycles will vary in their details, the causes, effects and trend lines are often quite similar. Looking at cycles gives us more context to how the market works over time and where it may be going — much more than dwelling in the immediacy of the present with excitable pronouncements of “The market’s crashing and won’t recover in our lifetimes!” or “The market’s crazy hot and the only place it can go is up!”
Market Cycles: Simplified Overviews
Up, Down, Flat, Up, Down, Flat…(Repeat)


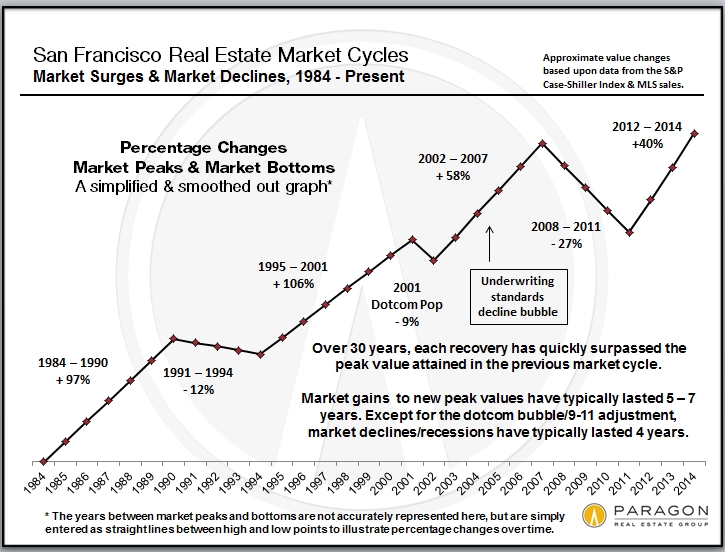
Smoothing out the bumps delivers these simplified overviews for the past 30 years. Whatever the phase of the cycle, up or down, while it’s going on people think it will last forever: Every time the market crashes, the consensus becomes that real estate won’t recover for decades. But the economy mends, the population grows, people start families, inflation builds up over the years, and repressed demand of those who want to own their own homes builds up. In the early eighties, mid-nineties and in 2012, after about 4 years of a recessionary housing market, this repressed demand jumps back in (or “explodes” might be a good description) and prices start to rise again. It’s not unusual for a big surge in values to occur in the first couple of years after a recovery begins.
Surprisingly consistent: Over the past 30+ years, the period between a recovery beginning and a bubble popping has run 5 to 7 years. We are currently about 2.5 years into the current recovery. Periods of market recession/doldrums following the popping of a bubble have typically lasted about 4 years. (The 2001 dotcom bubble and 9-11 crisis drop being the exception.) Generally speaking, within about 2 years of a new recovery commencing, previous peak values (i.e. those at the height of the previous bubble) are re-attained — among other reasons, there is the recapture of inflation during the doldrums years. In this current recovery, those homes hit hardest by the subprime loan crisis — typically housing at the lowest end of the price scale in the less affluent neighborhoods, which experienced by far the biggest bubble and biggest crash — may take significantly longer to re-attain peak values, but higher priced homes have already done so.
This does not mean that these recently recurring time periods necessarily reflect some natural law in housing market cycles, or that they can be relied upon to predict the future. Real estate markets can be affected by a bewildering number of economic, political and even natural-event factors that are exceedingly difficult to predict.
Mortgage Interest Rates since 1981
It’s much harder to decipher any cycles in 30-year mortgage rates over the same period. Despite the rate spike over the summer, rates remain very low by any historical measure, and this, of course, plays a huge role in the ongoing cost of homeownership.

******************************
In the 2 charts below tracking the S&P Case-Shiller Home Price Index for the 5-County San Francisco Metro Area, the data points refer to home values as a percentage of those in January 2000. January 2000 equals 100 on the trend line: 66 means prices were 66% of those in January 2000; 175 signifies prices 75% higher.
1983 through 1995
(After Recession) Boom, Decline, Doldrums

In the above chart, the country is just coming out of the late seventies, early eighties recession – huge inflation, stagnant economy (“stagflation”) and incredibly high interest rates (hitting 18%). As the economy recovered, the housing market started to appreciate and this surge in values began to accelerate deeper into the decade. Over 6 years, the market appreciated almost 100%. Finally, the eighties version of irrational exuberance — junk bonds, stock market swindles, the Savings & Loan implosion, as well as the late 1989 earthquake here in the Bay Area — ended the party.
Recession arrived, home prices sank, sales activity plunged and the market stayed basically flat for 4 to 5 years. Still, even after the decline, home values were 70% higher than when the boom began in 1984.
******************************
1996 to Present
(After Recession) Boom, Bubble, Crash, Doldrums, Recovery
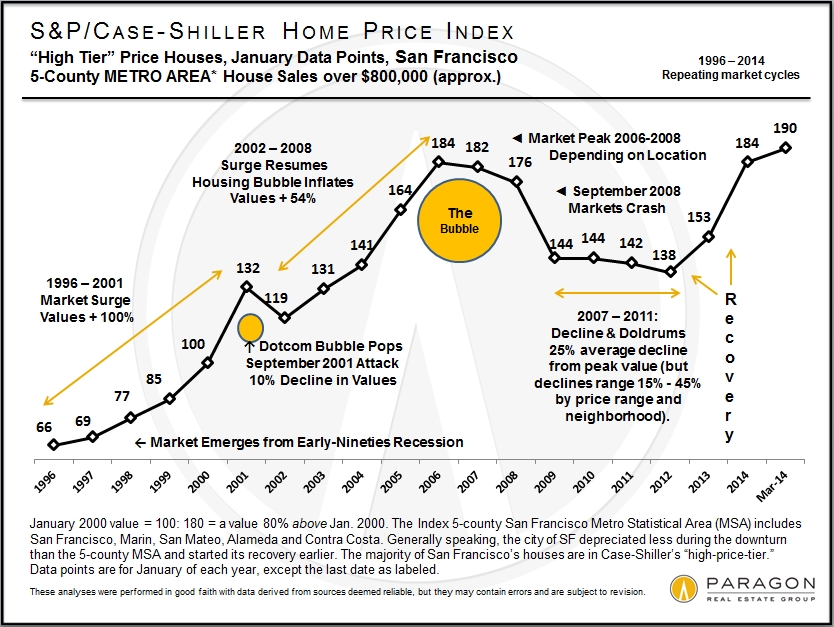 This next cycle looks similar but elongated. In 1996, after years of recession, the market suddenly took off and became frenzied — actually quite similar to what we’re experiencing today. The dotcom bubble pop and September 2001 attacks created a market hiccup, but then the subprime and refinance insanity, degraded loan underwriting standards, mortgage securitization, and claims that real estate never declines, super-charged a housing bubble. Overall, from 1996 to 2006/2008, the market went through an astounding period of appreciation. (Different areas hit peak values at times from 2006 to early 2008.) The air started to go out of some markets in 2007, but in September 2008 came the market crash.Across the country, home values fell 15% to 60%, peak to bottom, depending on the area and how badly it was affected by foreclosures — most of San Francisco got off comparatively lightly with declines in the 15% to 25% range. The least affluent areas got hammered hardest by distressed sales and price declines; the most affluent were typically least affected. Then the market stayed flat for about 4 years, albeit with a few short-term fluctuations. Supply and demand dynamics began to change in mid-2011, leading to the market recovery of 2012.
******************************
San Francisco from 2010 to 2014
A Strong Recovery


In 2011, San Francisco began to show signs of perking up. An improving economy, soaring rents, low interest rates and growing buyer demand coupled with a low inventory of listings began to put upward pressure on prices. In 2012, as in 1996, the market abruptly grew frenzied with competitive bidding. The city’s affluent neighborhoods led the recovery, and those considered particularly desirable by newly wealthy, high-tech workers showed the largest gains. However, virtually the entire city soon followed to experience similar rapid price appreciation.
San Francisco median home sales prices increased dramatically in 2012 and then accelerated further in the first half of 2013. San Francisco and the Bay Area are in the midst of a very dramatic recovery. Among other positive signs, new home construction is soaring once again, generally in the form of large new condo projects.
******************************
Different Bay Area Market Segments:
Different Bubbles, Crashes & Recoveries
1990 to Present
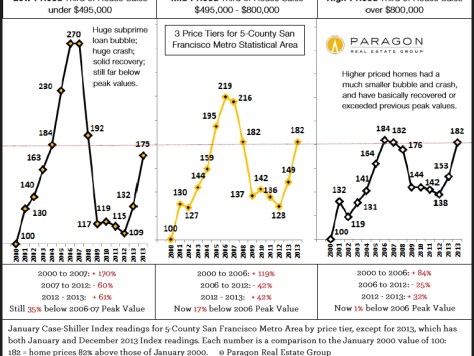
Again, all numbers in the Case-Shiller charts above relate to a January 2000 value of 100: A reading of 182 signifies a home value 82% above that of January 2000. These 3 charts illustrate how different market segments in the 5-county SF metro area had bubbles, crashes and now recoveries of enormously different magnitudes, mostly depending on the impact of subprime lending. The lower the price range, the bigger the bubble and crash. The upper third of sales by price range (far right chart) was affected least by the subprime fiasco and has now basically recovered peak values of 2006-2007. In the city itself, where many of our home sales would constitute an ultra-high price segment, if Case-Shiller broke it out, many of our neighborhoods have risen to new peak values. The lowest price segment (far left chart), more prevalent in other counties, may not recover peak values for years. If one disregarded the different bubbles and crashes, home price appreciation for all three segments since January 2000 is almost exactly the same, in the range of 75% to 82%.
All data from sources deemed reliable,
but may contain errors and is subject to revision.All numbers are approximate and percentage changes will vary
depending on the exact begin and end dates used.
Excellent data and presentation, thanks.