These Broker Metrics charts track weekly number of Active Listings over the past 6 months (early May to mid-October):
SFD, under $1m Active Listings – weekly inventory just below 6 month average, about same level as spring, lowest number of active listings since early July.

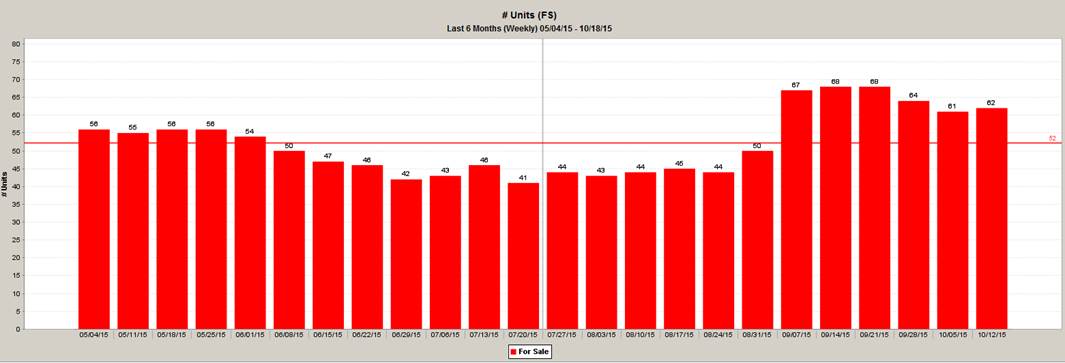
Condo, under $1m Active Listings – autumn inventory levels well above (about 25%) spring-summer levels

SFD, $1m – $1.499m Active Listings – weekly inventory just fell below 6-month average

Condo/Co-op, $1m – $1.499m – autumn inventory running far above (about 40%) spring-summer inventory levels

SFD, $1.5m – $1.999m Active Listings – autumn inventory levels well above (about 30%) spring-summer levels

Condo/Co-op, $1.5m – $1.999m – autumn inventory levels well above spring-summer levels

SFD, $2m – 2.499m Active Listings – autumn listing inventory running well above (33%) 6-month average, and equal to mid-May levels

Condo/Co-op, $2m+ Active Listings – inventory running about 25% above 6-month average, and well above spring-summer levels

SFD, $2.5m+ Active Listings – inventory running about 29% above 6-month average, and about 20% above May levels
