politics, poverty and employment for San Francisco, Marin, Napa,
Sonoma, San Mateo, Santa Clara, Alameda & Contra Costa Counties.
These charts are mostly based on U.S. Census surveys from 2010 to 2013. Each of the 8 counties examined contains areas of widely varying demographics, and the multiple reports analyzed (6+ for each county) contain counts and estimates made at different times. Though these statistics are broad overviews, we still found many fascinating insights – and hope you will as well.
———————————————————————
Ancestry, Race & Age
For the most part, the ancestry and race categories used below
are as designated in the U.S. Census reports.
Ancestry: This first chart is a collated overview of the 8 counties. The Bay Area is one of the most multi-cultural places on earth, but (not broken out on this chart) this diversity is not evenly spread: Different ethnic and national groups often cluster in specific counties. For example, San Francisco has the largest populations with Chinese or Russian ancestry; Santa Clara has, by far, the greatest number of residents from India, Vietnam or Mexico; Alameda leads in those of Portuguese or Pacific Island heritage. For breakdowns by county, U.S. Census reports can be accessed here.

Race: Marin County has by far the largest percentage white (non-Hispanic) population at 73%, followed by Sonoma and Napa. San Francisco has the largest Asian percentage at 34.4%, with Santa Clara just behind at 34.1%. Santa Clara is the only county where white isn’t the largest group – Asian is bigger by a tiny margin. Napa has the largest Hispanic percentage at 33%, with 5 other counties between 23% and 27%. Alameda has the most substantial percentage black population at 12%.

Foreign-Born: The foreign-born population in the Bay Area is large (behind only New York, Miami, LA and Chicago) with again, different groups predominating in different counties. About 50% of our foreign-born residents have acquired U.S. citizenship.

Children & Residents Living Alone: It has famously been said that San Francisco has more dogs than children, and at 13.4%, SF has the lowest percentage of residents under 18 of any major U.S. city. The other counties run close to the national percentage of 23%. San Francisco also has a much higher proportion of residents living alone than the other 7 counties – which probably correlates with a more urban lifestyle.
It’s interesting to note (not delineated on the chart) that though SF has relatively few children, its population aged 25 to 39 is very high, at just below 30%. Other Bay Area counties run from 16% (Marin) to 23% (Santa Clara). Demographers have noted that younger, post-college adults are moving into urban centers in large numbers, and this is clearly occurring in San Francisco. The city’s young, high-tech, start-up environment is undoubtedly supercharging this phenomenon.

———————————————————————
Affluence, Poverty, Education & Politics
Median Household Income: Many factors impact this statistic: household size, level of education, percentages of homeowners vs. renters, median age and of course, employment. Marin and Santa Clara are at the top of the list for highest household income. Obviously, various towns and neighborhoods – such as Pacific Heights, Ross, Atherton, Piedmont, Blackhawk – far exceed the figures in the chart below.

Poverty: According to the 2013 Wealth-X report, the Bay Area has the 3rd highest number of ultra-high-net-worth residents in the country, behind NY and LA. According to SFLuxe, the Bay Area is now home to over 70 billionaires – and it seems one can’t turn around in Safeway anymore without bumping into another new billionaire.
But surging affluence isn’t the only story.
The U.S. poverty-level income threshold does not vary by geographic region: For a family of 4, the national threshold is approximately $23,500. According to a Stanford think tank, adjusting for much higher local costs of living (especially housing) raises that threshold to $31,000 – $36,500 in Bay Area counties. In San Francisco, that increases the percentage of residents living in poverty to 23% and in Napa to 26%. Adjusted or not, the percentages add up to many hundreds of thousands of people – and this seems an appropriate place to remind all of us not to forget the neediest this holiday season.

Unemployment Rates: A big factor behind Bay Area economic conditions has been the strong growth in employment in recent years – in high-tech certainly, but also in the financial, medical, retail, construction and other industries. Many of these new jobs are very well paid.

Education: Some Bay Area counties are among the most educated in the country – not a big surprise considering the presence of 3 of the world’s great universities, and the Bay Area’s role as a hub for various high-education industries. Among U.S. major cities, San Francisco usually ranks near the top of the list just below Washington D.C. and Seattle.

Political Party Registration: This chart is self-explanatory. The Bay Area is a very blue region in a very blue state.

———————————————————————
Housing, Real Estate, Prices & Rents
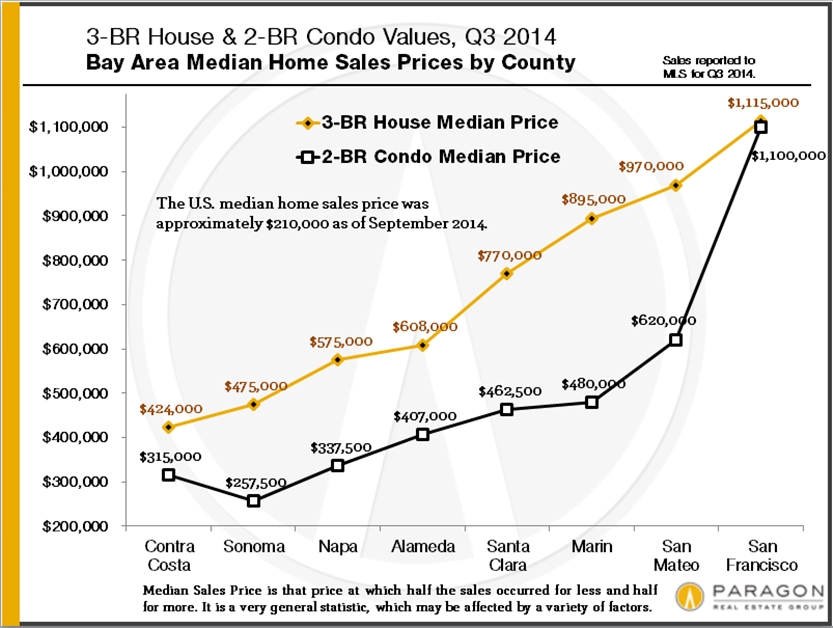
Median Home Prices: Apples to apples, San Francisco has the most expensive real estate in the Bay Area, followed by San Mateo and Marin. But all the counties include diverse neighborhoods featuring home prices ranging from relatively low to very high. One thing that stands out is the city’s distinctive condo market: the median price for 2-bedroom condos is just a tad lower than its median price for 3-bedroom houses. The reasons are twofold: firstly, very generally speaking, condos predominate in the more affluent city neighborhoods, while houses predominate in the less affluent. Secondly, thousands of new condos have been built in the last 10 years, or are under construction now, and by and large, they are of luxury or “ultra-luxury” quality and cost.
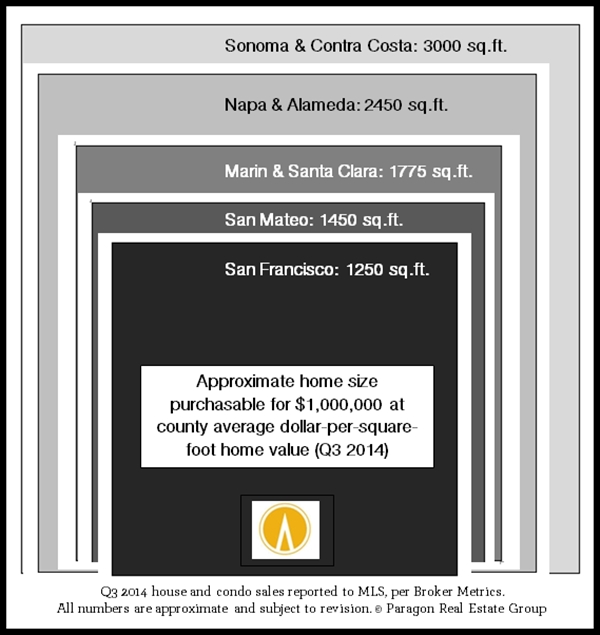
For a Million Dollars: Consider this infographic to be very approximate indeed, but it gives an idea of what one would get in square footage for $1,000,000 at each county’s overall house and condo average dollar-per-square-foot value. For the money, one gets more than twice the space in Contra Costa or Sonoma as in San Francisco or San Mateo. In many parts of the country, one could double or triple the square footage again.
Case-Shiller Home-Price Trends: The Case-Shiller SF Metro Area does not cover all 8 of the Bay Area counties, but it generally applies to the overall market. If Case-Shiller went back a bit further, we would see the late seventies/early eighties recession on this chart. From recession – which in the last 30-odd years has typically lasted 4-5 years – comes recovery (typically very robust recovery). Recovery usually takes 5-7 years to become utterly “over-exuberant,” which leads to a correction – and the next recession. We are still less than 3 years into our current recovery – which doesn’t mean that past trends will hold true in the future.
This chart aggregating all the sales of 5 counties is a huge simplification of hundreds of different micro-markets: Different areas and price segments of the Bay Area housing market had 2004 – 2008 bubbles and crashes of vastly different magnitudes. The lowest price segment rose and crashed the most (think “subprime loans”) and, though recovering dramatically, is still well below 2006 peak values. The higher priced housing segment had a much smaller bubble and crash, and has now exceeded its previous peak values of 2007-2008, in many cases by substantial margins. All 3 home price segments – low, middle and high – are now approximately 95% – 97% above their values of year 2000 (denoted as “100” on the chart).

Average Asking Rents: In the Bay Area, rising apartment rents and rising home prices have gone hand in hand, a big social, economic and political issue right now. Per the analytics firm Reis, San Jose, Oakland and Francisco are 3 of the 4 hottest rental markets in the country, as measured by rent appreciation.

Homeownership: With San Francisco’s homeownership rate of 37%, tenants outnumber homeowners by a large margin – and, not surprisingly, the city has some of the strongest rent and eviction controls in the country. (SF rent-limitation controls do not typically affect vacant or recently built apartments, so they do not reduce the “asking rent” values seen in the earlier chart.)

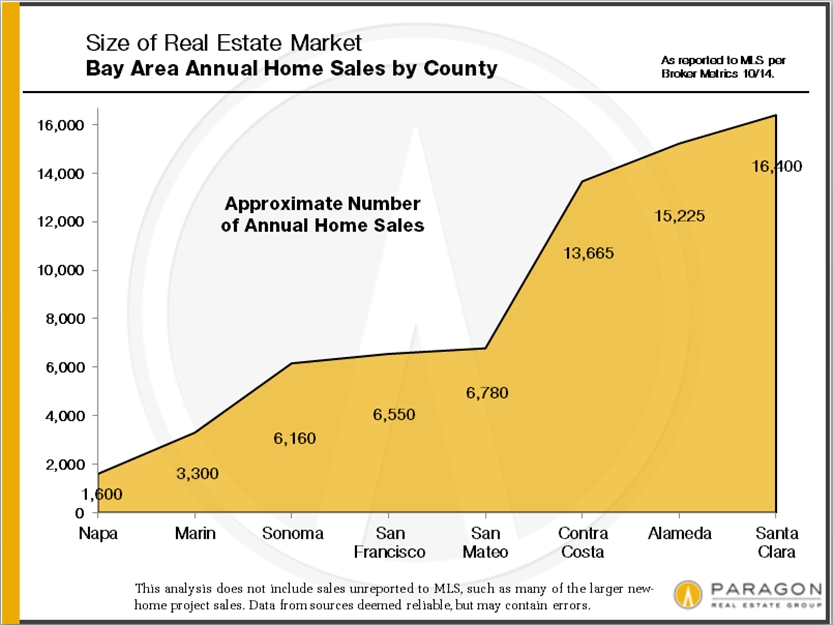
Market Size: Santa Clara and the two East Bay counties each have more than twice as many home sales as any of the other 5 counties. This is mostly due to significantly higher populations, but San Francisco’s relatively low number of home sales is also caused by the fact that almost two thirds of its units are rental housing: Thus, SF has more people but fewer home sales than San Mateo. Very limited supply amid huge demand is a big factor in its rising home prices.
Era of Construction: This chart illustrates how much emptier the Bay Area was 75 years ago, before World War II: Almost 50% of San Francisco’s housing was built prior to 1940, but in 6 of the other counties, the percentage falls to 12% or lower. In Santa Clara and Contra Costa, it drops to 5% – there were a lot of open fields where entirely new neighborhoods sit now.

———————————————————————
Population, Density & Size
Population & Population Density: Santa Clara and Alameda have the largest populations of the 8 counties. San Francisco, the second most densely populated city in the country (far behind Manhattan), has a population density 95 times that of Napa County.

Size in Square Miles: This chart reminds us what a small place San Francisco really is – and its inability to expand (except upward) plays an interesting role in many of its economic and social dynamics. Sonoma is the largest of the 8 counties and it is 33 times as large as San Francisco County.

The demographics and financial realities of the San Francisco Bay Area are constantly changing, so consider the numbers in these analyses to be very general estimates with reasonable margins of error. This report was created in good faith and is based on data from sources deemed reliable; however, it should not be considered comprehensive, may contain inadvertent errors and misrepresentations, and is subject to revision. Paragon emphatically supports all housing discrimination laws in its practice.